Research · November 2026
Same visits, different numbers: 15 analytics tools against a known truth
A field test of web and product analytics. We installed 15 tools side by side on one website, sent 122 visits we knew everything about, and compared what each tool counted and answered with what really happened.
- Published
- by Privatrak, under CC BY 4.0
- Disclosure
- Privatrak is our product and one of the fifteen tools. It got the same questions, scoring and ground truth as every other tool; section 3.12 says what that does and does not protect against.
- Cite as
- Privatrak (2026). Same visits, different numbers: 15 analytics tools against a known truth: a field test of web and product analytics. privatrak.com/research/analytics-field-test-2026
Abstract
Analytics tools disagree about the same website, and it is usually impossible to say which one is right, because nobody knows what really happened on the site. We built a site where we do know. Fifteen web and product analytics tools were installed side by side on one small static website, each with its standard snippet and its defaults. We then drove 122 scripted visits to it from 46 simulated visitors ("personas"), each with a known browser, network, country, consent choice and path through the site. Every request every page sent to every tool, and the tool's answer, was recorded. For each tool we therefore know not only what a perfect tool would report, but what that tool actually received.
We asked the same ten questions about the same two days (17 and 18 November 2026, UTC) twice: in each tool's own dashboard, the way a person would, and through each tool's MCP server, the interface that lets an AI assistant such as Claude query it. The questions covered visitors and page views, sources, a country, time on a page, a three-step funnel, file downloads, outbound clicks, rage and dead clicks, 404 pages, and purchases with revenue. We then read every tool for all four days, added server-side reporting where a tool supports it, and sent AI assistants, a browser agent and links from phone apps to the site.
Main results:
- Counting is accurate when the visits arrive. Most tools reported visitors within a few percent of the visits they actually received. The large differences between tools come from what never reached them or what they silently discarded: block lists, consent choices, automated browsers, VPN exits.
- "Visitor" is a different unit in almost every tool: a person per day, a person across days, a session, or a recorded session.
- Questions beyond counting separate the tools. Time on page ranged from 0 s to 18 min 45 s for a page whose true mean was 77 s. Revenue was shown correctly and plainly by a few dashboards only. One tool named the broken button with the right counts. Two tools could not show UTC days in their dashboards.
- The AI servers invented no numbers. Every number the assistants wrote came from a tool result or was simple arithmetic on one. Five servers gave the same numbers with two different models; the natural-language and list-based servers changed most.
- AI assistants' fetchers run no JavaScript. No script-based tool sees them. With a server-side feed, three tools named them as AI fetches; three counted them as ordinary visitors. No tool flagged a browser agent, and links opened from messaging apps arrived without a referrer.
The paper documents the method, every incident during the runs, the complete ground truth and per-tool delivery, every answer, and the raw data. The data is published with it.
1. Key findings
1.1 The scorecard
Each cell counts the ten questions by verdict. A verdict compares the tool's answer with what that tool was actually sent on 17 and 18 Nov (chapter 5), not with an ideal total, so a tool is not marked down for visits a blocker kept from it.
- ✓ answered and close to the expected number
- ≈ answered, but with another metric, another window or a clear gap
- ✗ answered and wrong
- – the tool cannot answer
- · not checked
Findability is the mean 1-5 score over the questions the dashboard could answer (5 = on the first screen, 1 = only through the docs). Where an answer had two parts with different scores (for example visitors and page views), the two are averaged.
| Tool | Dashboard ✓ / ≈ / ✗ / – | Mean findability | MCP ✓ / ≈ / ✗ / – | MCP server | MCP can set up |
|---|---|---|---|---|---|
| Privatrak | 7 / 2 / 0 / 1 | 4.3 | 7 / 2 / 0 / 1 | official, hosted | yes, with undo |
| Plausible | 8 / 1 / 0 / 1 | 4.7 | 7 / 2 / 0 / 1 (revenue failed) | community | no |
| Pirsch | 6 / 2 / 1 / 1 | 4.3 | 6 / 2 / 1 / 1 | community | no |
| Umami Cloud | 6 / 0 / 1 / 3 | 4.3 | needs a paid plan | official | – |
| Fathom | 3 / 2 / 0 / 5 | 4.8 | no usable server | community | – |
| PostHog | 6 / 4 / 0 / 0 | 3.3 | 7 / 3 / 0 / 0 | official, hosted | yes |
| Mixpanel | 6 / 3 / 0 / 1 | 3.1 | 7 / 2 / 0 / 1 | official, hosted | yes (onto a board) |
| LogRocket | 5 / 4 / 0 / 1 | 2.9 | 4 / 4 / 0 / 2 | official, hosted | no |
| Matomo Cloud | 1 / 7 / 1 / 1 | 4.2 | 1 / 7 / 1 / 1 | official, hosted | yes (raw API) |
| Cloudflare Web Analytics | 4 / 0 / 0 / 6 | 3.8 | 2 / 3 / 0 / 5 | generic Cloudflare API | could change anything |
| Google Analytics 4 | 0 / 9 / 0 / 1 | 3.2 | 0 / 9 / 0 / 1 | official, local | no |
| Microsoft Clarity | 0 / 8 / 1 / 1 | 3.6 | 1 / 6 / 1 / 2 | official, local | no |
| Amplitude | 2 / 7 / 1 / 0 | 2.6 | needs a paid plan | official | – |
| Mouseflow | 0 / 6 / 1 / 1 (2 ·) | 3.9 | needs a paid plan | official | – |
| Sentry | 0 / 1 / 0 / 9 | 4.0 | 0 / 1 / 0 / 9 | official, hosted | no |
How to read it:
- The scorecard measures answers to ten questions, not tools. Sentry is an error tracker and Cloudflare Web Analytics counts page loads only; their dashes mean the question is outside what they do. Chapter 2 matches tools to jobs.
- GA4's row is all ≈ for one reason. Its property ran on Los Angeles time, and neither its interface nor its API can show UTC days. Against its own window its numbers are close.
- Matomo's row is mostly ≈ because it counted 49 of the 78 visits it was sent. It is explained by its 30-minute visit, which merges some of a visitor's visits into one (78 → 59), and by visits from most of the VPN exits we used never appearing; the setting behind those drops is not identified (chapter 10). Against its own data its answers are consistent.
1.2 Eighteen findings
-
Counting is accurate when the visits arrive; arrival is the problem.
- Most tools counted within a few percent of the visits they actually received: Privatrak 72 visitors for 72 person-days, Cloudflare 95 visits for 95, LogRocket 97 sessions for 97, Fathom 71 for 70 and Umami 64 for 68 (counting two visits on 18 Nov that are not in the records, chapter 10).
- The big differences between tools come from what never reached them or what they dropped:
- Plausible silently discarded every visit from Playwright's Chromium build, the automation build of Chrome our scripted visitors used: 42 visits on 17 and 18 Nov, more than half of what it was sent. It answered 202 and marked the events dropped. It kept a real Chrome visit.
- Matomo counted 49 of the 78 visits it received.
- Mouseflow counts only the sessions it records: 55 of 82.
- Consent-gated tools (PostHog, Mixpanel, Amplitude, Matomo, Sentry, and Clarity in part) lost the declining visits that reached them, 16-19 per tool on those two days, as they should.
- Block lists and tracking protection stopped the script in about eight visits per tool, for every tool except Privatrak, whose script was on none of the lists we checked, most likely because it is new and not yet listed.
-
"Visitors" is a different unit in almost every tool. The same visits were reported as person-days (daily-hash tools), cookie-identified persons (PostHog, Mixpanel, Amplitude), sessions (Clarity, LogRocket, Mouseflow), visits (Cloudflare, Matomo for a range) and recorded sessions only (Mouseflow). Two tools show two different user counts on neighbouring screens: PostHog 39 in the headline and 41 in the tables below it, GA4 28 "active users" and 30 "total users".
-
Time on page is the least reliable metric in the market. The true mean wall-clock time per view of
/articlewas 77 s.Tool Reported time on /articleAmplitude 18 min 45 s Pirsch 18 min 16 s Matomo 3 min 55 s GA4 67 s, per user, not per view Plausible 66 s Privatrak 61 s (active time, as its docs say) PostHog 59 s Mouseflow 47 s Umami 0 s (its "visit duration" is measured between page views) Mixpanel, LogRocket, Fathom, Cloudflare, Clarity (per session only) and Sentry show no time per page. Pirsch's and Amplitude's values fit "time until the same visitor's next page view, even in a later visit" (chapter 14).
-
Timezones decide what "17 Nov" means, and two dashboards could not show UTC days. GA4 uses the property's zone and Pirsch's dashboard the domain's zone; both ended up off UTC despite being set at setup. Umami's date picker gives UTC days, but its URL stores the browser's midnights. Clarity takes exact days only through millisecond timestamps in the URL. GA4's answer for a finished day still changed a day later, as late data was processed.
-
Revenue is where most tools stumble. The site sent 7 purchases worth €56.
Shown plainly and correctly Shown, with a catch Plausible: €24 for its 3 delivered purchases GA4: converted to USD without a word ($26.44 for €24) Fathom: €56 Umami: opens in USD and shows "$0.00, 0 orders" until the currency is switched Amplitude: 40 for its 5, after changing a property default that gives 0 Pirsch: only as event metadata (7 × 8 by hand) Mixpanel: 40 for its 5, with no currency Privatrak: only through an Insights sum, with no currency Mouseflow and Clarity: no amount at all Through MCP, revenue was right in four servers of eleven: Privatrak, Pirsch, PostHog and Mixpanel. Plausible's community server failed with a schema error on every revenue metric.
-
Rage and dead clicks: one answer with both counts exact. The site's "Duplicate form" button does nothing. It was dead-clicked in 7 visits and rage-clicked in 4. Privatrak named it by its text with exactly 7 and 4, on its overview. LogRocket named it by text with the exact dead-click count (7 sessions) but found no rage clicks; Amplitude named it by text (5 dead; it has no rage event). Mixpanel (
b: 11 dead, 1 rage), Sentry (button#b, sampled replays) and PostHog (through a query, or per page in the interface) named only an id or a selector. Clarity flagged a paragraph of text as dead instead. Rage clicks were missed almost everywhere. The click patterns were fixed in the plan before any tool was read (section 3.12). -
404 pages are visible only where the tool or the site names them. Plausible and Pirsch detect 404 pages themselves; Fathom, PostHog and Mouseflow count them because the site sends each a 404 event; GA4 shows the page's title ("Page not found"). Everywhere else you must already know the broken path: Privatrak, Umami, Matomo and Cloudflare do not mark a page as a 404.
-
One-page dashboards answer in one or two clicks; product-analytics tools make you build a report per question. Plausible, Fathom, Umami, Pirsch and Privatrak's overview had most answers on the first screen. In Mixpanel, Amplitude and PostHog each answer was a chart to build: 6 to 10 clicks, with property names to know. Amplitude's charts have no total column. Mixpanel's home page said "No users seen in the last week" while events arrived all week.
-
AI (MCP) servers: what the server is shaped like matters more than which tool is behind it.
- Typed tools (Privatrak, Plausible, Pirsch, GA4's report tool) answered in one call per question.
- Raw query languages (PostHog's HogQL, Cloudflare's GraphQL, Matomo's raw API) made the assistant write and retry queries.
- Natural-language tools (LogRocket, Clarity) rewrote the question; LogRocket moved the period in five of ten answers.
- Two models: Privatrak, Plausible, Pirsch, Matomo and Cloudflare gave the same numbers with Claude Sonnet and Claude Opus. LogRocket, Sentry, Mixpanel, GA4 and, for one number, PostHog changed; GA4 and LogRocket for the better.
- No invented numbers: every number not found verbatim in a tool result was a rate, sum or unit conversion of numbers that were.
- Setup: four servers could set something up (Privatrak, PostHog, Mixpanel, Matomo). One of them could undo it (Privatrak).
-
Privacy surfaces differ. LogRocket and Sentry label sessions and replays with the visitor's full IP address. GA4's property setup pre-ticks three data-sharing options. Mouseflow starts a 14-day Premium trial without asking and records nothing until you confirm that personal data is excluded. Privatrak cannot answer "visitors from France" because it stores no location, by design.
-
Most tools recognise nobody across days; for some that is the design. Privatrak, Fathom, Plausible, Umami and Pirsch count a range's visitors as the sum of the days' visitors (a daily salt or hash, as their docs say). Matomo, PostHog, Mixpanel, Amplitude, Mouseflow and LogRocket recognise returning visitors through their storage; Matomo marked all 6 returning visits on each of the last two days as returning, exactly. Clarity recognises almost nobody (148 "unique users" for 40 personas), consistent with its cookie appearing only after consent (chapter 10).
-
Bounce rate is not one metric. For the same visits on 17-18 Nov the tools reported bounce rates from 3.8% to 92.9%. 56% of those visits saw one page, and 25% saw one page and clicked nothing.
-
Single-page apps and URLs are handled differently. PostHog recorded none of the site's
pushStateroutes with its default setup. Pirsch kept a URL fragment as a page. Some tools keep query strings as separate pages, others strip them. -
What browsers hold back decides more than the tools do.
- Do Not Track: Mixpanel honours it. Clarity sent nothing for visitors with both Do Not Track and Global Privacy Control, but recorded a visit with Do Not Track alone.
navigator.webdriver(a browser driven by a program says so): Plausible and Mouseflow send nothing, PostHog mostly nothing.- uBlock Origin Lite blocked every tool but Privatrak (not yet on the lists); Firefox's strict mode blocked most.
- A consent decline is stored: a phone that declined the banner one day was still opted out of the cookie tools the next day.
-
AI assistants' fetchers are named by three tools. They run no JavaScript, so no script sees them. With a server-side feed from the web server's access log, Privatrak (AI assistants report), Matomo (AI Chatbots report) and PostHog (classification of its
$http_logevents) named ChatGPT's and Claude's fetches as AI fetches. Mixpanel, Amplitude and GA4 counted every fetch as an ordinary visitor's page view; Plausible and Umami dropped them; Pirsch showed nothing. Gemini's app fetched with the bare user agentGoogle, which nobody attributes to Gemini. -
Nobody flagged the browser agent. A visit by Claude in Chrome, an AI agent driving a real browser, was an ordinary visitor in every tool that recorded it. Privatrak, whose documentation describes a rule for such agents, did not flag it either: the rule needs two clicks on one page, and the agent clicked once per page.
-
In-app browsers send no referrer. Links opened from WhatsApp, Slack and iMessage were Direct everywhere. The ChatGPT app appends
utm_source=chatgpt.comto its links, which the tools read five ways: an AI channel, a referrer, a UTM value, "Other Advertising", or nothing. -
The fifteen tools cost a visitor 1.3 MB and 141 requests for three pages. Amplitude (309 KB), PostHog (254 KB) and GA4 (183 KB) are the heaviest; Plausible (3 KB), Pirsch, Fathom and Umami the lightest. Four tools set their cookies on the whole parent domain. Privatrak, Plausible, Fathom, Umami, Pirsch and Cloudflare stored nothing in the browser.
2. Which tool for which job
No tool is best at everything, and most of them count well when visits reach them. They differ in what they receive, what they call a visitor, and which questions they can answer. This chapter matches tools to jobs, using only what the lab measured and what the vendors' own pages say (chapter 12, as of 20 Nov 2026). It is the one chapter that judges; every judgement points to the numbers behind it.
A word on bias. Privatrak is ours, and it is recommended for two of the jobs below. Those two lines rest on the same measurements as every other line: delivery (chapter 5), the dashboard and MCP answers (chapters 7 and 8), and the findings by topic (chapter 9). Privatrak's gaps are listed beside it, as for every tool.
2.1 The criteria
| Criterion | What we looked at | Where |
|---|---|---|
| Delivery | how many of the visits reached the tool and were kept, given blockers, consent and the tool's own filters | chapter 5 |
| The unit | what "visitor" means, and whether a person is recognised across days | chapters 9.1, 10 |
| Answers | which of the ten questions the dashboard answers correctly, and how easily | chapter 7 |
| AI access | how well an AI assistant answers through the tool's MCP server | chapter 8 |
| Privacy | cookies, consent needed, what is stored and shown | chapters 9.14, 10, 12 |
| Weight | what the snippet costs a visitor | chapter 10 |
| Price | the free plan and the cheapest paid plan, from the vendor's page | chapter 12 |
2.2 Recommendations
| You want | Best fit in this test | Why | Watch out for |
|---|---|---|---|
| Simple, privacy-first traffic statistics for a website | Plausible; also Fathom, Umami, Pirsch, Privatrak | Most answers on the first screen (findability 4.3-4.8); no cookies (their vendors state that no consent banner is needed); Plausible's page views were exact on every day for the real browsers it kept; snippets of 3-8 KB | Plausible discards automated browsers and many VPN and data-centre visits on its server (finding 1). Fathom placed some VPN and residential exits in Brazil and showed no UTM campaigns. Pirsch's dashboard shows only the site's own timezone. Umami opens revenue in USD |
| Product analytics without cookies: features, funnels, goals, click problems, AI-assistant access | Privatrak | Most complete delivery of all tools (102 of 104 visits, because its script was on no block list yet); 7 of 10 dashboard answers right; the one answer with both rage and dead click counts exact; automated visits marked rather than dropped; 7 of 10 MCP answers right (with PostHog, Mixpanel and Plausible the most), and setup through MCP with undo; an AI assistants report fed by the web server | Stores no location, so no country reports; no 404 detection; revenue only through an Insights sum, without a currency; no recognition across days (by design); its agent rule missed a one-click-per-page agent. PostHog documents a cookieless mode too (not tested here) |
| Full product analytics with identified users: retention, cohorts, replay, experiments | PostHog; then Mixpanel | Widest feature set; PostHog also labels AI fetchers when it gets server logs; both recognise visitors across days | Need cookies and consent; answers are reports to build (findability 3.1-3.3); PostHog recorded none of the single-page-app routes by default; Mixpanel counted AI fetchers as users; Mixpanel honours Do Not Track, so those visitors are missing |
| Recognising returning visitors | Matomo; also Amplitude, PostHog, Mixpanel | Matomo marked every returning visitor on the last two days as returning, exactly | Cookie tools need consent; Matomo did not record visits from most VPN exits we used and merges visits within 30 minutes; Amplitude's time on page was inflated (18 min 45 s for a 77 s read) and its charts have no totals |
| Session replay and heatmaps | LogRocket for debugging; Mouseflow; Clarity (free) | LogRocket's session count was exact (97 for 97); Clarity is free with no traffic limit | Clarity's counts are unreliable without consent: it splits pages into separate sessions and recognises almost nobody across days. Mouseflow records a sample (500 sessions a month free) and nothing from automated browsers. LogRocket and Sentry show full IP addresses |
| Errors in the front end | Sentry | Built for it: errors with replays | Not an analytics tool |
| Free counts with no setup | Cloudflare Web Analytics | Exact visits (95 for 95); free | Answers almost nothing beyond page loads and visits |
| The free default most sites already have | Google Analytics 4 | Free and deep; recognises returning users | Its days follow the property's timezone and cannot be read in UTC; a finished day's numbers changed later; blocked by block lists and Firefox's strict mode; seven setup screens with data sharing pre-ticked |
| Seeing AI assistants read your pages | Privatrak, Matomo, PostHog, each fed from the web server | They named ChatGPT's and Claude's fetches as AI fetches (chapter 11) | Every tool needs a server-side feed for this; nobody attributes Gemini's fetches; no tool flagged a browser agent |
2.3 What decides the choice more than the tool
- What reaches the tool. Block lists stopped every script except Privatrak's (not yet listed); consent banners and Do Not Track silence the cookie tools; Plausible and Matomo drop some visitors on their servers. The biggest differences in the totals came from this, not from counting.
- What "visitor" means. Cookieless tools count a person per day; cookie tools follow a person across days, with consent. Choose the definition you can live with, legally and analytically.
- Which questions you ask. If you need funnels, revenue, click problems or a country, check that the tool answers that question at all (chapter 7): several dashboards cannot.
- Whether an assistant will ask for you. If an AI assistant is going to query the tool, check the server's shape: typed tools answered in one call, natural-language tools rewrote the question, and five servers gave the same numbers with two models (chapter 8).
2.4 By situation
- A marketing site, privacy-first, mostly human visitors: Plausible, or Privatrak if you also want features, funnels and click problems without cookies.
- A software product that needs to know what people do in the app, without cookies: Privatrak.
- A software product that needs identified users, retention and experiments, and can run a consent banner: PostHog.
- Next to either, as needed: Sentry for errors, LogRocket for debugging replays, Clarity for free heatmaps (not for counts).
3. Method
3.1 Goal and questions
The lab was built to answer many questions from one set of visits, all of them about what a site owner sees when the same visitors reach different tools:
- For the same visits, how many visitors, page views and sessions does each tool report?
- How does each tool count a visitor who returns the next day, switches network, or changes browser?
- What does each tool report as time on page and bounce rate for visits of known length?
- Which referrers and UTM tags survive into each source report (letter case,
ref=, a missing referrer)? - Which tools count, filter or flag scripted, automated, VPN and data-centre visits?
- Which tools flag which click patterns as rage, dead, error or slow clicks?
- Asked through each tool's MCP server, which answers match the ground truth?
- What do AI assistants' fetchers, AI agents and links from phone apps look like in each tool?
The rule for every tool was to run it with its defaults wherever a default exists, because that is what its users get. Anything switched on or set up was written down, and was done before the visits it should count. Several tools count goals, funnels and heatmaps only from the moment they exist.
3.2 The test site
clicklab.privatrak.com is a small static site for a fictional form builder called "Mapleform". It was served by our own web server under a hostname of its own. Every page loads every tool's standard install snippet unchanged, plus a probe script (the ground truth, section 3.8).
| Path | What it is | Test elements (data-lab) |
|---|---|---|
/ | home page | |
/article | a long article (scroll depth, reading time), with an outbound link to https://www.w3.org/WAI/tutorials/forms/ and a PDF download /mapleform-checklist.pdf | article-outbound, article-pdf |
/product | product page with template links that carry a query (/product?id=quote, /product?id=booking) and a link to a page that does not exist (/templates) | product-id-quote, product-id-booking, product-broken |
/pricing | three plan buttons; each sends Plan selected (plan = Free / Team / Business) and goes to /checkout?plan=team | choose-free, choose-team, choose-business |
/checkout?plan=team | fake order form with no payment-like inputs; its button sends Purchase and goes on | place-order |
/order-complete | "Order placed (test site, nothing charged)" | |
/contact | contact form that goes on to /thanks after a real submit event; no field value appears in any URL | contact-form, contact-send |
/thanks | "Thanks, we'll reply within a day" | |
/search?q=… | a header search form on every page; the results page lists matching pages | search-input, search-submit |
/app, /app/forms, /app/answers, /app/settings | one page whose tabs switch with history.pushState, no reload; a direct load of any of the four works | app-tab-* |
any unknown path (e.g. /templates) | a 404 page with HTTP status 404 that loads the probe and every tool | notfound-home |
/lab | nine click-test elements (below) | lab-a … lab-i |
The nine /lab elements. Each element tests one kind of click problem.
| Element | Label on the page | What a click does | What it tests |
|---|---|---|---|
| A, error | "Save draft" (button) | throws a JavaScript TypeError | error clicks |
| B, nothing | "Duplicate form" (button, id="b") | nothing at all | dead clicks, rage clicks |
| C, slow | "Publish form" (button) | shows "Published." after a delay | slow clicks |
| D, decorative | "Quote template, 12 fields" (a card, not a control) | nothing | false positives on non-controls |
| E, new tab | "Open pricing in a new tab" (link) | opens /pricing in a new tab | a working link that some tools see as dead |
| F, text | a paragraph of body text | nothing | clicks on plain text |
| G, chart | an SVG chart, "Answers per day" | nothing | clicks on graphics |
| H, works | "Show preview" (button) | shows a preview at once | the control case |
| I, disabled | "Delete form" (disabled button) | nothing | disabled controls |
The consent banner. It is shown on every page until a choice is made, and the choice is kept in localStorage under lab-consent:
- Accept calls each tool's documented consent-granted API.
- Decline calls the consent-denied API.
- Ignoring the banner calls nothing.
No consent defaults were set, so each tool kept its own.
| Tool | Consent call used by the lab |
|---|---|
| GA4 | gtag("consent", "update", {ad_storage, analytics_storage, ad_user_data, ad_personalization}) |
| Matomo | rememberConsentGiven / forgetConsentGiven |
| PostHog | opt_in_capturing / opt_out_capturing |
| Mixpanel | opt_in_tracking / opt_out_tracking |
| Amplitude | setOptOut(!granted) |
| Clarity | clarity("consentv2", {ad_Storage, analytics_Storage}) |
| Mouseflow | start() / stop(); Mouseflow has no consent call, and its consent article starts recording on consent |
| Sentry | stopping the replay; Sentry has no consent call either |
| LogRocket | none: LogRocket documents no consent call, so it was never told about a decline |
| Privatrak, Plausible, Fathom, Umami, Pirsch, Cloudflare | none: cookieless tools need no consent call |
3.3 Events and goals
Events go through each tool's own documented call, from one adapter script. Each tool is wrapped, so one failure never stops the others. The probe records every event too, as ground truth.
| Event | Properties | Revenue |
|---|---|---|
| Plan selected | plan | – |
| Purchase | plan, order_id (random per visit) | 8.00 EUR for Team (Free 0, Business 24) |
| 404 | path | – (only for tools whose docs give a 404 recipe, e.g. Plausible) |
Names. Names were written as above where a tool allows spaces, and in the tool's own convention otherwise. GA4, for example, takes plan_selected, and purchase with value, currency and transaction_id.
Revenue was sent through each tool's own revenue API where one exists:
- Plausible: revenue goal.
- Fathom:
_valuein cents. - Umami:
revenue. - Matomo: an ecommerce order.
- GA4:
purchase. - Amplitude: Revenue.
- PostHog and Mixpanel: a
revenueproperty. - Privatrak: the detail
total(Privatrak's name for a property sent with an event).
Goals and funnels set up in each tool that has them:
- Goals: the page
/thanks; the events Plan selected and Purchase, with revenue where offered; outbound link; file download; 404. - Funnel 1, contact:
/pricing→/contact→/thanks. - Funnel 2, checkout:
/pricing→ Plan selected →/checkout→ Purchase.
What each tool needed for this is listed in chapter 6.
3.4 The tools
Fifteen tools ran on the site. All were on free plans, or on free trials that need no card.
| Tool | Plan in the lab | Type | Visitor recognition (vendor docs) |
|---|---|---|---|
| Privatrak | ours | cookieless product analytics | HMAC of IP, user agent and project with a random daily key per project, deleted when the day is counted |
| Google Analytics 4 | free | web analytics, cookies | _ga cookie |
| Plausible | 30-day trial (Business features) | cookieless web analytics | hash of a daily salt, domain, IP and user agent; salt rotated every 24 h |
| Fathom | trial | cookieless web analytics | SHA-256 of IP, user agent, site ID and a daily salt (midnight UTC) |
| Umami Cloud | free (Hobby) | cookieless web analytics | uuid of website, IP, user agent and a salt rotated monthly by default |
| Pirsch | 30-day trial | cookieless web analytics | hash of IP, user agent, date and a per-site salt |
| Matomo Cloud | 21-day trial | web analytics, cookies | _pk_id cookie, 13 months |
| Cloudflare Web Analytics | free | cookieless page-load analytics | no visitor ID; visits only |
| PostHog | free | product analytics | distinct_id in a cookie and in local storage, 1 year |
| Mixpanel | free | product analytics | cookie / local storage ID |
| Amplitude | free Starter | product analytics | device ID in storage |
| Microsoft Clarity | free | session replay, heatmaps | cookies |
| Mouseflow | free (500 sessions) | session replay, heatmaps | cookies |
| Sentry | Developer (50 replays/month) | error monitoring with replays | replay session |
| LogRocket | free (1,000 sessions) | session replay | cookies / storage |
Left out:
- Simple Analytics was dropped at setup: adding the domain failed with an error.
- Hotjar / Contentsquare: the free plan has no frustration signals.
- Datadog and FullStory: no free plan.
3.5 Personas
Every scripted visitor is a persona with fixed properties. Cookieless tools hash the network and user agent, while cookie tools keep an ID, so personas were built to test exactly where the counting differs.
Browsers. Each persona has one of these browser profiles:
| Engine | User agent | Viewport |
|---|---|---|
| Chromium | Chrome 141 on Windows, macOS or Linux; Edge 141 on Windows | 1536 × 864, 1440 × 900, 1920 × 1080, 1366 × 768 |
| Chromium, mobile | Chrome 141 on Android 10 | 412 × 915 |
| Firefox | Playwright Firefox, own user agent | 1440 × 900, 1280 × 800 |
| WebKit | Safari 26.6 (Playwright WebKit) | 1512 × 982 |
| WebKit, mobile | iOS Safari | 390 × 844 |
Locales and countries.
- Locales are en-US (New York or Los Angeles time), en-GB (London), de-DE (Berlin) and fr-FR (Paris).
- A persona's country follows its locale: US, GB, DE or FR.
Automation styles.
- Person-like (
human): automation markers hidden, person-like input throughout. - Agent-like (
agent): markers hidden, but it moves and clicks like a program. The pointer jumps straight onto what it clicks, and the page scrolls in one go. - Marked (
marked): Playwright's own markers (navigator.webdriver) left on. - Assignment: every sixth persona is marked, and every sixth starting at the third is agent-like.
Visitors the tools see less of. These are fixed traits on chosen personas:
- uBlock Origin Lite (Chromium): p10, p23.
- Firefox Enhanced Tracking Protection set to Strict: p13, p26.
- Do Not Track and Global Privacy Control: p05, p11, p17 (p17 also crosses midnight).
Shared network. p27, p28 and p29 share one IP, like an office.
Other network. p04 and p07 each make one return visit from a different network, as a person switching from home to mobile data would (visits named alt-ip).
Consent. Person-like personas were split into thirds, dealt from a fixed seed: accept, decline, ignore. Agent-like and marked personas never answer the banner.
Groups in series r4:
- 30 residential personas (p01-p30)
- 6 VPN personas (p31-p36), two per country (US, GB, DE)
- 10 data-centre personas (p37-p46)
The per-persona table is Appendix C.
3.6 Visit kinds and sources
Visit kinds:
| Kind | Path |
|---|---|
| bounce | one page, leaves |
| reader | /article, reads to a set depth, leaves |
| browser | home → product → pricing, and similar |
| product | /product and its ?id= variants |
| contact | /pricing → /contact → form → /thanks |
| buyer | /pricing → plan button → /checkout → Place order → /order-complete |
| searcher | uses the header search, /search?q=… |
| app | the pushState app, switching tabs |
| downloader | clicks the PDF link (same tab) |
| outbound | clicks the w3.org link |
| lost | follows the broken link to /templates (404) |
| lab | clicks one /lab element in a pattern: once, three times 200 ms apart, four times 300 ms apart, and so on |
Sources. Each visit arrives from one of these:
| Source | How it arrives |
|---|---|
| direct | no referrer, no tags |
| google, bing, duckduckgo | search engine referrer |
| hackernews, reddit, linkedin, x | referrer (t.co for X) |
| chatgpt | referrer chatgpt.com plus utm_source=chatgpt.com |
| perplexity | referrer www.perplexity.ai |
| newsletter | utm_source=Newsletter&utm_medium=email&utm_campaign=November-Launch (mixed case on purpose) |
| producthunt | ref=producthunt, no referrer |
| ads | Google referrer plus utm_source=google&utm_medium=cpc&utm_campaign=forms-us |
Series r4 in numbers:
- Sources: direct 29, LinkedIn 13, Hacker News 11, Google 10, Reddit 9, DuckDuckGo 8, Product Hunt 8, ChatGPT 7, Bing 6, Perplexity 6, newsletter 5, X 5, ads 5.
- Kinds: lab 21, browser 17, reader 15, bounce 13, buyer 9, product 8, contact 8, app 8, searcher 8, downloader 5, outbound 5, lost 5.
3.7 Networks
| Network | How | Why |
|---|---|---|
| Residential | a residential proxy, one sticky session per persona (asked to last 7 days), in the persona's country; reached through a local relay that holds the proxy login (from r4) | person-like visits must not be filtered as data-centre traffic, and cookieless tools must not merge everyone behind one IP |
| VPN | the NordVPN app on the laptop, real app exits (not its SOCKS servers), switched by hand per country; two personas per country share an exit | VPN users are a real share of visitors and land on data-centre IPs that some tools filter |
| Data-centre | one NordVPN Singapore exit, used on purpose as a control group | the bot-filter comparison |
Guards.
- Before and after every VPN visit, the runner looked up the exit (ipinfo.io). It stopped the whole run unless the exit was a known VPN host in the right country, so nothing was recorded from the home connection if the VPN dropped.
- The manifest keeps every exit only truncated to /24.
3.8 Ground truth and checking
Two independent records hold the ground truth:
- The runner's manifest (the runner is the Playwright program that drove every visit and recorded its requests), one line per visit (published as
visits.jsonl, with IP networks replaced by pseudonyms). It records:- persona, day, slot, network, engine, mode, kind, source and consent
- every page and its time
- what the visit did (read depth, form sent, order placed, download, outbound, lab pattern)
- every tool's requests with their HTTP status, or the browser's failure reason
- The probe, a small script loaded on every page. It sends beacons to the lab's own server, so they land in the Caddy access log:
load, with page, referrer, query,webdriverand user agentleave, with time on page, visible time, max scroll and every click- events
Each visit carries a run label in the URL hash (#r=r4-d1-p06-contact), which the probe reads and removes.
A checker script compares the two after every round. It checks that each visit has:
- exactly one user agent and one IP
- a probe beacon
- a leave beacon for every page loaded
- 2xx answers from every tool that should answer
It also lists every failed tool request. It fetches the access log until the copy's size matches the server's, because three fetches during the run came back short.
Per-tool expected numbers (published as expected-all.json and truth-*.json) count, for each tool, only the visits whose requests to that tool were answered 2xx. A tool that never got a visit is not blamed for it. For tools that wait for consent, these numbers are upper bounds: a 2xx can be a configuration request without a recorded event.
3.9 Scoring the answers
The ten questions, asked about 17 and 18 Nov (UTC days) in every dashboard and through every MCP server:
- visitors and page views
- top sources
- visitors from France
- average time on
/article - the contact funnel
/pricing→/contact→/thanks - PDF downloads
- outbound clicks to w3.org
- the element on
/labwith the most rage and dead clicks - views of the 404 page
- purchases and revenue
Verdicts:
- ✓ answered and close to the tool's expected number
- ≈ answered, but another metric, another window, or a number that differs from the expected one, even when the delivery records explain the gap
- ✗ answered and wrong
- – the tool cannot answer
- E the server failed (MCP)
- · not checked
Dashboard steps are the screens and clicks from the tool's start page to the number. We count steps, not seconds: an agent's speed says nothing about a person's.
Findability, 1 to 5. This score is subjective, and is the point of the scoring. It rates how easy the way to the number was, independent of the step count.
| Score | Meaning |
|---|---|
| 5 | on the first screen, or one obvious click away, named in plain words |
| 4 | one menu away, where you would look first |
| 3 | had to look around, or the name was unclear but the guess was right |
| 2 | in an unexpected place (settings, a filter, a report builder), or named misleadingly; needed a second try or the docs |
| 1 | found only through the docs or search, or not found |
MCP difficulty, 1 to 5, is the assistant's own score per question:
| Score | Meaning |
|---|---|
| 5 | one obvious call with plain parameters |
| 4 | the right tool quickly, after a lookup |
| 3 | trial and error, or interpretation needed |
| 2 | a raw query language, or several failed calls |
| 1 | not possible |
3.10 Schedule as planned
The visits are test traffic either way. The days only buy what needs a real calendar: a visitor returning the next day, a visit across midnight, daily salt rotation, and the tools' own processing delays.
| Day | Plan |
|---|---|
| 0 | build the site, probe and runner; create the accounts; deploy |
| 1 | every single-visit experiment and every persona's first visit; phone and Claude-in-Chrome rounds |
| 2 | next-day returns; a pair of visits across midnight UTC |
| 3-4 | later returns; the MCP questions once the tools show days 1-2 |
| 5-6 | read every dashboard after processing delays |
In practice the MCP test ran on 19 Nov and the dashboard test on 20 Nov, the lab's last day (chapter 4).
3.11 Run after the series (20 Nov)
The parts of the plan that series r4 did not run were run on 20 Nov, after its last visits, with a server-side feed and Cloudflare in front first (chapter 11):
- Real AI fetchers: ChatGPT, Claude (through Claude Code's web fetch tool), Perplexity and Gemini each asked to read a lab URL. Perplexity fetched no page (only one
/robots.txt). - Agents: Claude in Chrome clicked through. ChatGPT agent mode and Perplexity Comet's agent need paid plans and were not run; Comet's search fetched nothing.
- Phone-app links: WhatsApp (a Slack link), the ChatGPT app and iMessage, on one iPhone. The Hacker News and Reddit apps were not run.
- Heatmap viewers: opened in Clarity, Mouseflow and LogRocket; they load no lab pages (chapter 10).
- Not run: Google Search Console's live test, and Clarity's Bot Activity (it shows a CDN's logs; Cloudflare's were read directly).
3.12 Our role, and what it does not protect against
Privatrak is our product, and it is one of the fifteen tools. We designed the site, chose the questions and scored the answers. These are the safeguards, and their limits:
- The ground truth is mechanical. Expected numbers come from the request records, not from judgement: a tool is compared with what it was sent, which favours no tool. The records are published (
visits.jsonl), so every expected number can be recomputed. Page loads the runner did not record are published beside them (unrecorded.json) and counted as "up to" on top of the expected numbers. - The questions were fixed before any tool was read, and are the same for every tool. They are ordinary analytics questions; we did not add questions Privatrak alone can answer. Two of the ten are ones it cannot answer on its own (a country; 404 pages, which it does not mark), and a third (revenue) only without a currency.
- Verdicts follow written rules (section 3.9), and every answer is quoted, so a reader can re-score it. Findability is one assessor's judgement, for every tool alike.
- Gaps are listed by one rule for every tool: in the tool profiles (chapter 13), a gap is what cost an answer or could mislead a reader, and deliberate choices are listed apart. Privatrak's are in its profile like everyone else's.
- The click patterns were fixed before any tool was read. The rage-click visits clicked "Duplicate form" three times 200 ms apart or four times 300 ms apart (section 3.6). Privatrak's own default counts three clicks within a second each as a rage click, which those patterns meet; so do the thresholds most tools document.
- Privatrak's setup flow changed during the lab. On 15 Nov, after its 6-step setup had been noted next to the other tools' flows, it was changed to two screens (chapter 6).
- Our own browser blocks Privatrak. The browser we work in blocks requests to Privatrak's ingest so that we do not track ourselves. Visits made in it (the Click Map and Element Picker sessions of 18 Nov, the stray visit of 20 Nov, the Chrome visit of the manual round, the first agent run) reached every tool but Privatrak (chapter 4).
- What it does not protect against: we know Privatrak best, so we may have found its answers faster; we chose which "beyond counting" areas to examine; and Privatrak's own setup flow was changed during the lab (chapter 6). Weigh the Privatrak lines with that in mind.
4. How the runs went
4.1 Four series, three stopped
The data in this paper is series r4 (17 to 20 Nov 2026). Three earlier series were started and stopped. Each stop came from a fault in the lab, not in a tool, and each fault was fixed before the next series.
| Series | Dates | What ran | Why it stopped | Fix |
|---|---|---|---|---|
| Pilot | 14 Nov | ~28 visits from a laptop (through a NordVPN Singapore exit) and a server | data-centre exits only: Matomo dropped them, Plausible kept 3 of ~28, cookieless tools merged everyone behind one IP | residential proxies for person-like visits |
| Check visit | 14 Nov, 17:43-17:51 UTC | 8 visits from one UK residential IP through every flow | (a check, not a series) Plausible dropped all 6 events of the repeat buyer: it drops by IP reputation, per IP | runner records Plausible's x-plausible-dropped header per visit |
| r2 | 15 Nov | day 1 complete: 73 visits (residential, data-centre, VPN) | what a page sent while unloading carried the browser's own user agent (Chrome/153, HeadlessChrome, bare WebKit), not the persona's: 30 of 73 visits split in two for IP+UA tools; found when Privatrak's checkout funnel showed 1 order for 3 | Chromium and Firefox get the persona's user agent at launch; every visit ends by navigating to about:blank |
| r3 | 16 Nov | day 1 complete: 73 visits | on all 18 residential WebKit visits, Umami, LogRocket and Cloudflare got nothing and Amplitude nothing on 11: WebKit's CORS preflights went through the authenticated proxy without the login and failed (NSURLErrorDomain -1013); the self-test could not show it because it blocks every tool request | a local relay holds the proxy login, so no browser request meets a 407; a checker written to catch such gaps |
| r4 | 17-20 Nov | 122 visits over 4 days, all as planned | completed |
Other r2 and r3 incidents shaped the runner:
- Shared proxy-auth cache. Two contexts with different proxy logins in one Chromium shared a proxy-auth cache and stalled. Fix: one browser per proxied visit, with the proxy set at launch.
- Hanging page loads. Tool scripts hanging on flaky proxy exits kept the page's load event from firing. Fix: a visit waits for the document, gives the load event 20 s, then carries on (recorded as a slow load). A hanging script then counts against that tool instead of ending the visit.
- Strict Firefox lists. The strict Firefox profiles could not download their tracker lists through the proxy. They fetched them once without it, from Mozilla's server only, never the lab site.
- Sticky sessions don't always hold. In r2, a sticky proxy session moved to another /24 within 28 minutes.
Before r4, a full self-test ran through the relay, with tool requests switched on and two check personas (k01, k02) that are never part of a series. It covered every flow on Chromium, WebKit and Firefox on the laptop (24 visits), plus a buyer visit in Chromium and WebKit on the server. The checker found 0 problems.
4.2 Day 1: 17 Nov (73 visits)
| Time (UTC) | Round | Visits | Notes |
|---|---|---|---|
| 05:08-05:38 | residential, two at a time, then a second pass | 51 | the scheduled 05:00 start did not fire (the laptop was asleep); started by hand |
| 05:38-05:43 | residential, return within the hour | 6 | |
| 05:57-06:03 | data-centre group, NordVPN Singapore (GSL Networks) | 10 | started automatically when the exit matched |
| 06:38-06:40 | VPN Germany (PacketHub) | 2 | p35, p36 |
| 10:02 | VPN UK (Clouvider) | 2 | p33, p34 |
| 10:06 | VPN US (PacketHub) | 2 | p31, p32 |
Day 1 complete: 73 of 73 (57 residential, 10 data-centre, 6 VPN).
What the checker found on day 1. There were 19 missing tool deliveries. None was retried, because a visit run again would count twice in every other tool.
-
Umami answered HTTP 500 from 05:09 to 05:17 UTC on every engine, then 200 again from 05:18. In that window:
- 8 visits got a 500.
- 4 Chromium visits sent no Umami request at all.
- One WebKit visit had 4 requests cancelled.
Umami is therefore missing 13 of the first 15 visits of the day. This was an outage on Umami's side.
-
GA4 missed p07 and p18 entirely. gtag.js failed with
ERR_TUNNEL_CONNECTION_FAILEDon both visits of each persona. Those two sticky exits could not open a tunnel to googletagmanager.com, while every other tool reached them. This is a proxy artefact, comparable to r3's Fathom failures on two personas. -
r4-d1-p26-bounce(Firefox, strict tracking protection, slow load):- All 5 Privatrak requests ended
NS_BINDING_ABORTED. - Pirsch's request ended in a proxy gateway timeout.
- LogRocket's script failed.
- All 5 Privatrak requests ended
-
Plausible dropped all 9 Chromium visits of the data-centre group and kept the one Firefox visit (
r4-d1-p44-searcher), exactly as in r3 on another exit network. The browser matters, not only the IP (chapter 9.12). -
r4-d1-p35-outbound(WebKit, VPN) sent its leave beacon with Playwright WebKit's bare user agent, withoutVersion/26.6 Safari/..., at the click on the outbound link. An IP+UA tool counts that leave as another visitor. -
Two WebKit leaves were lost through the proxy.
r4-d1-p08-outbound(WebKit, residential) and the 16 Nov WebKit check visit have a load beacon and no leave beacon. -
One late read. After the US round the checker said 26 problems; a minute later it said 20, as before. Its first copy of the access log was short. Since then, the checker is read again a minute after a round before a new problem is believed.
4.3 The midnight pair: 17/18 Nov (8 visits)
- Where it ran. On a server, in a Playwright container (headed, with a virtual display), through the same residential sessions. It ran 4 visits from 23:44 UTC (p16-p19,
-late) and 4 from 00:05 UTC (-early), and each slot had a second pass. All 8 ran on the first pass. - Before the start:
- A dry run of 4 + 4 visits.
- One request through the relay came out GB / Virgin Media.
r4-d2-p19-late(WebKit, downloader) changed exit IP during the visit. The load beacon came from one residential IP, and the leave beacon about 70 s later from another.- Around the switch, requests failed with
Peer failed to perform TLS handshake(Umami, Cloudflare, LogRocket's script). - All 5 Privatrak requests ended "Load request cancelled".
- In IP+UA tools p19-late may count as two visitors, and several tools have it only partly.
- Around the switch, requests failed with
- The pair as a salt test. p16, p17 and p18 kept the same IP before and after midnight, so for them only the day changed. That makes them the clean test of daily-salt rotation.
4.4 Runner fixes between day 1 and day 2
-
WebKit outbound, reproduced locally. When a Playwright WebKit tab follows a link to another site, nothing the page sends on
pagehidearrives: not sendBeacon, not a keepalive fetch, not an image.- Following a link on the same site, or going to
about:blank, delivers everything with the persona's user agent. - Setting the user agent by header or by route changes nothing.
Fix (WebKit only): the navigation the click starts is held (aborted by a page route on the outbound host, after the click and everything the tools do on it). The page is left to
about:blank, then the outbound URL is opened. The record saysoutbound.leftVia: "about:blank". - Following a link on the same site, or going to
-
Leave beacons in the checker. Every page loaded must report leaving. Over day 1 this found one more visit,
r4-d1-p04-reader(WebKit):- The runner had closed the browser 1.5 s after
about:blank. - Over day 1, the last leave beacon arrived 0.2-1.6 s after a visit's end through the proxy, with 1.41, 1.49 and 1.64 s at the top.
- The wait is now 5 s for every engine.
- The runner had closed the browser 1.5 s after
-
Checker fetch. The checker copies the access log and fetches it until the bytes match, up to 5 tries.
-
Proof visits. Two WebKit outbound check visits, one through the proxy and one through the VPN, delivered both load and leave beacons with the persona's user agent. The checker found 0 problems.
4.5 Day 2: 18 Nov (29 visits)
| Time (UTC) | Round | Visits | Notes |
|---|---|---|---|
| 23:44 (17 Nov) / 00:05 | midnight pair, on the server | 8 | above |
| 05:17-05:27 | residential, two at a time | 12 | the laptop was on a VPN the whole time (laptop → VPN → residential proxy → site); the tools saw only the residential exits |
| 06:13-06:17 | VPN Germany (PacketHub): p01, p03 returning via VPN, p35, p36 | 4 | p36 went through /pricing, /contact, /thanks |
| 06:40-06:43 | VPN UK (PacketHub): p02 via VPN, p33, p34 | 3 | one short log fetch, second matched |
| 06:48-06:50 | VPN US (Datacamp): p31, p32 | 2 | two short fetches before the third matched |
Day 2 complete: 29 of 29.
Two new problems:
r4-d2-p11-contact(Firefox) stopped after/and/pricing. The click to/pricingarrived, but the page's load event did not come within 20 s and the runner gave up the visit. The tools saw two page views and no contact form.r4-d2-p13-outbound(Firefox, strict) loaded/articleand never reported leaving. One Privatrak request endedNS_BINDING_ABORTED. It was the first Firefox outbound visit of the series. A later local test showed that Firefox, unlike WebKit, does deliverpagehidesends on a cross-site navigation (chapter 14), so the cause is likely the proxied, strict context. This visit is why several tools show 6 outbound clicks where 7 were made.
Runner fix after the residential round. Following a link now waits for the new page's response and its DOMContentLoaded, then gives its load event 20 s without failing the visit. Two full test runs passed 44 of 45 each. The misses were one Firefox contact visit and one WebKit lost visit; each passed 4 of 4 when run alone, so they were most likely clicks that missed under the load of three browsers at once.
4.6 Day 3: 19 Nov (10 visits)
- The round. 06:05-06:14 UTC: 10 residential visits from the laptop without the VPN. One visit got no exit IP on the first pass and ran on the second.
- What the checker found:
r4-d3-p06-contact(WebKit): gtag.js failed ("The network connection was lost"), so GA4 has nothing of it.r4-d3-p09-app(Firefox): Clarity's script aborted.r4-d3-p09-appalso changed exit at the very end, like p19-late. Only what was sent as the visit ended came from the new IP.
- Residential IPs are not kept across days, although every session asked for a 7-day lifetime.
- Within a day, a persona kept its IP.
- On every new day, every returning persona came from a new IP.
- By day 4, p11-p15 had used four different IPs in four days, p16-p19 three, and p20 two.
- What this means for the reading:
- A next-day return is a new IP plus the same user agent.
- Tools that count by a daily-salted IP+UA hash count it as new either way.
- So the next-day returns test only the tools that keep something in the browser (cookies, local storage). The persona state files carry that across days.
- The daily-salt test rests on the midnight pair.
4.7 The manual round: 19 Nov, 07:12-07:20 UTC
One of us made four visits in real browsers, with no automation. Each opened with a #r=human-… label so the probe could tell them apart. The laptop was on a home connection and the phone on mobile data, both in Thailand. Their raw access records are not published.
| Visit | Browser | Pages (time on page) |
|---|---|---|
human-l1-chrome | Google Chrome 156, macOS (our work browser, which blocks Privatrak's ingest) | /article 85 s, /pricing 16 s, /checkout?plan=team 4 s |
human-l2-safari | Safari 26.5, macOS | /article 77 s, /pricing 19 s, /checkout?plan=team 5 s |
human-p1-app | iOS Safari 27.2, opened from a messaging app | /article (no leave), /article 25 s, 3 s, 41 s, /pricing 11 s; mobile IP changed within the visit |
human-p2-safari | iOS Safari 27.2 | /article 39 s, 2 s, 2 s (reloads), /pricing 15 s, /search?q=Test 3 s, /article 2 s |
What the round showed:
- No referrers. Every entry came without a referrer, including the link opened from the app, so it shows as direct.
- Real phones change IP too. The phone's mobile IP changed 26 s into P1, as the proxy did twice.
- Plausible kept the real Chrome visit. Today, Thailand, Chrome: 1 visitor, 3 page views, visit duration 1 min 40 s (true: 104 s). So Plausible's dropping of every lab Chromium visit is about Playwright's Chromium build, not Chrome users.
- Plausible's merging. It showed 4 visitors from Thailand that day: L1, L2, and the phone as two visitors (its two IPs). P1 after the IP switch and P2 merged, because they had the same IP and user agent.
4.8 Day 4: 20 Nov (10 visits) and one stray visit
- The round. 04:02-04:10 UTC: 10 residential visits (p11-p20), all on the first pass. The checker found 0 problems. Every returning persona came from a new /24 again.
- The stray visit, at about 05:01 UTC during the dashboard test:
- Clicking the site's name in Cloudflare's site list opened
clicklab.privatrak.comin our own browser (Chrome on macOS, no#r=label). The tab was closed at once. - Tools count it on 20 Nov; LogRocket shows a 1-event session from Thailand.
- It is not in the manifest or in any ground truth, and it does not touch 17-18 Nov.
- Clicking the site's name in Cloudflare's site list opened
4.9 After the series: 20 Nov, from 10:26 UTC
- Server-side sender live from 10:26 UTC (GA4 from 10:50).
- Cloudflare in front of the site from 11:10 UTC, with Cloudflare's own injected beacon switched off at 11:20 UTC; no visit ran in between.
- AI fetchers, agent and phone-app rounds 11:44-12:06 UTC, page-weight runs 12:13 UTC, a diagnostic page view at 12:44 UTC and a repeat of the agent visit at 14:24 UTC. Chapter 11 has the timeline. None of them touch 17-18 Nov.
- The laptop used a VPN with a German exit during these rounds.
4.10 Incidents that affect the 17-18 Nov numbers
The complete list, so that every gap in chapters 7 and 8 can be traced:
| Visit or window | What happened | Who is affected |
|---|---|---|
| 17 Nov 05:09-05:17 | Umami answered HTTP 500 | Umami: 13 of the first 15 visits missing |
| p07, p18 (17 Nov) | gtag.js could not load through two proxy exits | GA4: 4 visits missing |
r4-d1-p26-bounce | Firefox strict and a slow load: Privatrak requests aborted, Pirsch gateway timeout, LogRocket script failed | those three |
r4-d1-p08-outbound | WebKit leave lost through the proxy | whatever the tools send as the tab leaves: the outbound click, Privatrak's page view update |
r4-d1-p35-outbound | leave sent with WebKit's bare user agent | IP+UA tools may count a second visitor |
r4-d1-p04-reader | leave lost (browser closed 1.5 s after about:blank) | time on page for that view |
r4-d2-p19-late | exit IP changed within the visit; TLS failures around the switch | IP+UA tools: possibly two visitors; Umami, Cloudflare, LogRocket partly; Privatrak received nothing of it |
r4-d2-p11-contact | stopped after /pricing | no contact form: a funnel entry without completion |
r4-d2-p13-outbound | Firefox leave lost on the cross-site navigation | outbound click: 6 instead of 7 in several tools |
| Data-centre group, 17 Nov | 9 of 10 visits Chromium on a hosting network | Plausible dropped 9 of 10 |
| All Playwright-Chromium visits | Plausible answered 202 and dropped the events | Plausible: 42 visits on 17-18 Nov |
17 Nov 05:33 UTC, r4-d1-p14-lab-E-newtab-one | "Open pricing in a new tab" opened /pricing in a second tab, which the runner does not record: +1 page view, same visitor, not in the records | every tool that loaded in that tab; Privatrak holds it |
| 18 Nov 11:11 UTC, Click Map | we opened Privatrak's Click Map and Element Picker (its tools for naming page elements, which open the site in a browser tab, #st-picker=… in the URL) on the site: +1 visitor, 4 page views, not in the records | every tool but Privatrak (our work browser blocks it) |
| 18 Nov 17:56 UTC | an unknown visitor: +1 visitor, 2 page views, not in the records | every tool; Privatrak holds 1 page view (/) |
5. Ground truth: what happened on 17 and 18 Nov
Both answer tests ask about 17 and 18 Nov 2026, in UTC days. This chapter gives two things for those days:
- what a perfect tool would have reported
- what each real tool was actually sent
Every verdict in chapters 7 and 8 is measured against the second.
5.1 What a perfect tool would report
On 17 and 18 Nov the lab made 104 visits: 102 from series r4, plus the two WebKit proof visits of 17 Nov (section 4.4), which used two check personas and count like any visit because every tool received them. These came from 47 personas, which makes 72 person-days and 201 page views.
| Measure | Value |
|---|---|
| Visits | 104 (17 Nov: 79, 18 Nov: 25) |
| Personas | 47 |
| Person-days (what a daily-salt tool should count as visitors) | 72 |
| Page views | 201 (17 Nov: 142, 18 Nov: 59) |
| Visits from France | 19 visits, 12 person-days |
Views of /article, mean wall-clock time per view | 25 views, 77.0 s |
Contact funnel /pricing → /contact → /thanks (visits) | 23 → 4 → 4 |
PDF downloads (/mapleform-checklist.pdf) | 5 |
| Outbound clicks to w3.org | 7 |
Views of the 404 page /templates | 5 |
| Purchases / revenue | 7 / 56 EUR (each 8 EUR, Team plan) |
| Sources (visits) | direct 26, LinkedIn 11, DuckDuckGo 8, Hacker News 8, Google 8, Reddit 8, then the rest |
"Duplicate form" on /lab | dead clicks in 7 visits, rage clicks in 4 |
When the visits happened. All times are UTC.
| Hour | Visits (r4) | What |
|---|---|---|
| 17 Nov 05:00-06:00 | 64 | day 1 residential round and returns within the hour |
| 17 Nov 06:00-07:00 | 5 | data-centre group (rest) and VPN Germany |
| 17 Nov 10:00-11:00 | 4 | VPN UK and US |
| 17 Nov 23:00-24:00 | 4 | midnight pair, before midnight |
| 18 Nov 00:00-01:00 | 4 | midnight pair, after midnight |
| 18 Nov 05:00-06:00 | 12 | day 2 residential round |
| 18 Nov 06:00-07:00 | 9 | day 2 VPN rounds |
So 17 Nov is dominated by one hour: 64 of its 77 r4 visits came between 05:00 and 06:00. Several MCP reports noticed this burst and called it test traffic (chapter 8).
Clicks on the /lab elements:
| Element | Visits with a click | Visits with rage clicks |
|---|---|---|
| B, "Duplicate form" (does nothing) | 7 | 4 |
| A, "Save draft" (throws an error) | 2 | 1 |
| C, "Publish form" (slow) | 2 | 1 |
| D, decorative card | 2 | 1 |
| G, SVG chart | 2 | 1 |
| H, "Show preview" (works) | 2 | 1 |
| I, "Delete form" (disabled) | 2 | 1 |
| F, plain text | 1 | 1 |
| E, "Open pricing in a new tab" | 1 | 0 |
"Rage" here means the visit's click pattern was three or more quick clicks, for example three 200 ms apart or four 300 ms apart. Whether a tool calls that a rage click depends on its own threshold.
Three page loads are not in the records, so they are not in these numbers (section 4.10):
| Time (UTC) | What | Visitors | Page views |
|---|---|---|---|
| 17 Nov 05:33 | the new tab of r4-d1-p14-lab-E-newtab-one (same visitor) | 0 | 1 |
| 18 Nov 11:11 | our opening of Privatrak's Click Map on the site | 1 | 4 |
| 18 Nov 17:56 | an unknown visitor | 1 | 2 |
So any tool may show up to 2 more visitors and visits and up to 7 more page views than the numbers below. Which of them a tool received cannot be told from the records, so chapters 7 to 9 add them as "up to" where they matter. The data download lists them in unrecorded.json.
5.2 What each tool was actually sent
Requests to a tool can fail, be blocked, be dropped by the tool, or never be made (after a consent opt-out). The manifest records each request's outcome, so each tool has its own expected numbers.
| Tool | Visits | Person-days | Page views | France visits / pd | Funnel | Outbound | 404 | Purchases | |
|---|---|---|---|---|---|---|---|---|---|
| All (perfect) | 104 | 72 | 201 | 19 / 12 | 23 → 4 → 4 | 5 | 7 | 5 | 7 |
| Privatrak | 102 | 71 | 199 | 18 / 11 | 23 → 4 → 4 | 4 | 7 | 5 | 7 |
| Fathom | 99 | 68 | 194 | 19 / 12 | 22 → 4 → 4 | 4 | 6 | 5 | 7 |
| Pirsch | 99 | 68 | 194 | 18 / 11 | 22 → 4 → 4 | 4 | 6 | 5 | 7 |
| LogRocket | 97 | 67 | 192 | 18 / 11 | 22 → 4 → 4 | 3 | 5 | 5 | 7 |
| Cloudflare | 95 | 66 | 190 | 18 / 11 | 22 → 4 → 4 | 3 | 5 | 5 | 7 |
| GA4 | 92 | 65 | 186 | 18 / 11 | 22 → 4 → 4 | 3 | 5 | 5 | 7 |
| Clarity | 84 | 60 | 176 | 14 / 9 | 22 → 4 → 4 | 3 | 4 | 5 | 7 |
| Umami | 83 | 66 | 164 | 15 / 11 | 20 → 3 → 3 | 2 | 4 | 4 | 7 |
| Amplitude | 82 | 60 | 164 | 16 / 10 | 20 → 4 → 4 | 3 | 3 | 5 | 5 |
| Mouseflow | 82 | 58 | 165 | 15 / 9 | 16 → 3 → 3 | 3 | 5 | 5 | 5 |
| Matomo | 78 | 58 | 150 | 13 / 9 | 19 → 3 → 3 | 3 | 4 | 4 | 5 |
| Sentry | 77 | 57 | 146 | 13 / 9 | 18 → 2 → 2 | 3 | 4 | 4 | 5 |
| Mixpanel | 69 | 52 | 138 | 9 / 7 | 18 → 2 → 2 | 3 | 3 | 4 | 5 |
| PostHog | 66 | 50 | 126 | 10 / 7 | 13 → 2 → 2 | 4 | 4 | 4 | 3 |
| Plausible | 39 | 26 | 71 | 3 / 2 | 5 → 1 → 1 | 3 | 4 | 3 | 3 |
How to read the table:
-
pd means person-days: one persona on one day.
-
Privatrak, checked event by event. Its stored page views (Privatrak keeps events; only the per-visitor session records are deleted) were matched to the records by page and time. 198 of its 199 page views are there; the missing one is the last tab of
r4-d1-p22-app, whose request was cancelled as the WebKit browser closed. The other two stored page views are the unrecorded new tab and the unknown visitor's/. That makes the 200 its dashboard shows. Its visitors are 72: 71 person-days plus the unknown visitor. Per day it shows 47 and 25 against 46 and 26, one more on 17 Nov and one fewer on 18 Nov; the session records that would say which were deleted by the nightly sweep, by design, so the split cannot be traced further. -
Some counts can exceed what a tool really recorded. The outbound, PDF and 404 columns count visits that delivered something to the tool. For consent-gated tools, a 2xx can be a configuration request without a recorded event, so their numbers are upper bounds.
-
GA4 is on its own window. GA4's property runs on Los Angeles time, so in practice it reports a different window: 17 Nov 08:00 to 19 Nov 08:00 UTC. For that window the manifest gives 38 delivered visits, 23 personas and 92 page views. The manual round adds 3-4 users and about 17 page views.
Appendix D has the same table with per-day splits, the delivered sources per tool and the /lab clicks per tool.
5.3 Why visits did not arrive
The 102 r4 visits on 17-18 Nov, per tool. Columns:
- ✓ at least one 2xx
- D dropped by the tool
- S the script failed to load
- B blocked in the browser
- 5 the tool answered HTTP 500
- ✗ every request failed
- · nothing sent (split by whether the visit declined consent)
| Tool | ✓ | D | S | B | 5 / ✗ | · after decline | · other |
|---|---|---|---|---|---|---|---|
| Privatrak | 100 | 2 ✗ | |||||
| Pirsch | 97 | 4 | 1 ✗ | ||||
| Fathom | 97 | 4 | 1 ✗ | ||||
| LogRocket | 95 | 7 | |||||
| Cloudflare | 93 | 8 | 1 ✗ | ||||
| GA4 | 90 | 8 | 4 | ||||
| Clarity | 82 | 9 | 4 | 7 | |||
| Amplitude | 81 | 8 | 13 ✗ | ||||
| Umami | 81 | 8 | 7 × 500, 2 ✗ | 4 | |||
| Mouseflow | 80 | 9 | 13 | ||||
| Matomo | 77 | 8 | 17 | ||||
| Sentry | 76 | 8 | 18 | ||||
| Mixpanel | 68 | 8 | 19 | 7 | |||
| PostHog | 65 | 8 | 16 | 13 | |||
| Plausible | 37 | 44 | 8 | 13 |
The causes, tool by tool:
- Blockers and tracking protection account for most of the S column, which is about 8 per tool. Two personas ran uBlock Origin Lite (Chromium) and two ran Firefox strict tracking protection, and these block most tools' scripts. Privatrak's script was not on the block lists, so it shows no S. A separate test in October found it on none of three major lists.
- Consent opt-outs (30 declines on these days) stop Matomo, Sentry, Mixpanel and PostHog, and some Clarity sends. Mouseflow's and PostHog's "other" counts include visits with no consent answer where the tool waits for consent or records only some sessions.
- Plausible answered 202 and marked the events dropped for 44 visits: 42 Chromium and 2 WebKit. All Playwright-Chromium visits were dropped. The manual round shows that a real Chrome is kept, so the trigger is Playwright's Chromium build combined with IP reputation (chapter 9.12).
- Umami's outage: 7 visits got HTTP 500, 2 failed, and 4 sent nothing during it.
- Amplitude's 13 failed visits all declined consent. Their only Amplitude requests (10 WebKit, 3 Firefox) were cancelled as the page changed, so after an opt-out nothing was answered. In effect these are consent losses too.
- GA4's 4 blocked visits are Firefox strict tracking protection, which blocks GA4 but not every tool. Of its 8 failed script loads, 4 are the two proxy exits that could not reach googletagmanager.com (
ERR_TUNNEL_CONNECTION_FAILED), and 4 are uBlock Origin Lite.
Over the whole series (122 visits, four days), Appendix B gives the totals per tool and a symbol for every single visit.
5.4 Returns, IPs and what the visits can test
| Test | Can it be read from r4? | Why |
|---|---|---|
| Same-day return within the hour | yes, for every tool | same IP, same browser state |
| Next-day return, cookie and storage tools | yes | browser state was saved per persona and carried across days |
| Next-day return, IP+UA hash tools | no: always a new visitor | the residential proxy gave every returning persona a new IP each day, despite a 7-day sticky session |
| Daily salt rotation | yes, from the midnight pair | p16, p17 and p18 had the same IP at 23:44 and 00:05 |
| Network switch (Wi-Fi → mobile) | partly | three residential personas returned on day 2 through the VPN, with the same browser and another network |
| Shared IP (household or office) | yes | p27-p29 share one residential IP; VPN pairs share an exit |
| VPN filtering | yes | 6 VPN personas, 15 visits |
| Data-centre filtering | yes | 10 visits from one NordVPN Singapore exit |
| Automation flag | yes | 17 marked visits, 16 agent-like |
| Consent | yes | 30 accept, 35 decline, 57 ignore over the series |
6. Setup and onboarding
Notes written while setting up each tool (14 and 15 Nov) and connecting each MCP server (19 Nov). Steps means the screens between an empty account and an install snippet in hand.
6.1 From sign-up to snippet
| Tool | Steps | What worked | What got in the way |
|---|---|---|---|
| Plausible | 1 | lands on "Add tracking to your site" with the snippet, four install methods (script, WordPress, GTM, NPM) and an "I've installed it" check | the snippet text can't be selected by automation (fine for people) |
| Fathom | 1 | site ID shown in the site list | no domain asked; the site was named "Privatrak" |
| Umami | 1 | "Tracking code" dialog straight from the website list | – |
| Microsoft Clarity | 1 | the project opens on "Getting started" with the code | – |
| Amplitude | 1 | one-line snippet with checkboxes (Session Replay, Autocapture) that rewrite it live; an "AI prompt" for coding agents is the recommended path | API key shown truncated |
| LogRocket | 1 | app created during sign-up | – |
| Pirsch | 2 | after adding the domain, "Choose your integration" with the snippet and a copy button; server-side API offered as a first-class option | the public sign-up URL redirects to the login page |
| Privatrak | 6 (2 since 15 Nov) | screen 1 asks only for the project name and time zone (pre-filled from the browser); screen 2 shows the install code with the website key already in it (created with the project), as tabs for the script tag, WordPress, Shopify, Next.js, Nuxt, npm and an AI-assistant prompt, with the auto-capture choices, a live first-event check and a privacy line; tracker and privacy settings keep their defaults | – |
| Mixpanel | 2 | settings page is clear (data residency, timezone, session timeout) | the project token is not visible, only a Copy button; EU residency needs api_host set by hand in the code, or data goes nowhere |
| Mouseflow | 2 | "Get started" checklist; MCP server promoted on the start page; detects that the code is installed | starts a 14-day Premium trial without asking; records nothing until you click "Activate Tracking" in a banner and confirm that personal data is excluded, although the code is already on the site |
| Matomo Cloud | 3+ | tracking code generator with options | the instance URL is derived from the site name (clicklabprivatrakcom.matomo.cloud); the site was named "privatrak."; dense admin UI |
| Cloudflare Web Analytics | 4 | clear three-step wizard; says "Cloudflare does not track individual visitors" up front | buried under Observability → Analytics → Web analytics; a hostname not on Cloudflare gives a confusing "click here to use … which does not belong to Cloudflare websites" |
| PostHog | 4 | token, project ID and region shown clearly; the wizard offers npx @posthog/wizard | heatmaps, dead clicks and session replay are each off by default, on three different settings pages among ~60 sections; a persistent "no events yet" banner |
| Sentry | 5 | the product picker shows each product's free volume after the trial ("50 replays / mo"); toggling products reconfigures the loader snippet; an agent-handoff prompt is offered first | five screens (agent prompt, repo connect, platform, products, alerts) before the snippet |
| Google Analytics 4 | 7 | – | account → property → business details → objectives → data collection; three data-sharing options pre-ticked; a Terms dialog with a separate GDPR DPA checkbox; the install code is now a Google tag container (gtm.js?id=GTM-…), not the G-… measurement ID most guides describe |
| Simple Analytics | – | – | adding the domain failed with an error; dropped from the lab |
Privatrak's row describes its current setup (since 15 Nov). When the lab was set up on 14 Nov it took 6 steps: allowed domains and a heavy privacy step were asked during setup, the flow ended on a "You're all set" screen without a snippet, and a key had to be created separately. The flow was changed on 15 Nov: the website key is created with the project, and the install code follows on the second screen.
6.2 Defaults found and what was set up
Rule: keep every default and write down every change. Everything below was done before the visits it should count. Where a tool's goals are computed over past data, that is noted.
| Tool | Timezone default → set | On by default | Set up for the lab |
|---|---|---|---|
| Plausible | Asia/Bangkok (from the browser) → UTC | outbound links, file downloads, form submissions and 404, each with its goal already created | goals Visit /thanks, /pricing, /contact, /checkout (funnel steps must be goals), Plan selected, Purchase as a revenue goal (EUR); property plan; funnels Contact and Checkout (sequential). Funnels compute retroactively: the dialog shows last month's conversion while you build it. About 30 clicks |
| Fathom | UTC | bot blocking; events created by the first trackEvent call | nothing: no funnels and no page-view goals. Event currency set to Euro (applies to past data) |
| Umami Cloud | per-user display preference from the browser (Bangkok); no UTC entry in the list → Atlantic/Reykjavik (UTC+0) | – | goals Visit /thanks, Plan selected, Purchase; funnels Contact and Checkout (60-minute window by default). Goals and funnels are reports over past data. Heatmaps and replays need the Business plan |
| Pirsch | the setting is "used when the viewer's browser has none", and the select kept showing Bangkok after choosing UTC and reloading. The domain was found on Asia/Bangkok during the tests | File Download, Outbound Link Click and 404 arrive on their own | goals Visit /thanks, Plan selected, Purchase (custom metric revenue, decimal); funnels Contact and Checkout (steps by path or event, mixed) |
| Matomo Cloud | Thailand and Thai Baht (from the browser) → UTC, EUR (through Matomo's own API; the form's dropdowns did not take a change from automation) | Ecommerce and site search; the site's URL saved with a trailing dot | goals Visit /thanks, Plan selected, Outbound link (w3.org), File download (.pdf); funnels on Visit /thanks and on the ecommerce order ("Sales"); heatmaps for /lab, /pricing and /; session recording of all visits (1,000 sample limit, 100%). Heatmaps and recordings capture only from the moment they exist |
| Google Analytics 4 | Los Angeles and US dollars (property created from a browser in Thailand) → Iceland time (GA has no plain UTC) and Euro, as recorded at setup. The property was found on America/Los_Angeles during the tests: the change did not hold, or applied elsewhere | enhanced measurement (page views, scrolls, outbound clicks and four more); purchase a key event | custom dimension Plan; plan_selected, file_download, click marked as key events; contact_sent created without code (a page_view whose URL contains /thanks) and marked as a key event. Creating it pre-selects a default value of 1 US dollar per key event, which had to be switched off. An "Analytics Advisor" popup and an email-preferences dialog with all four boxes pre-ticked appeared on first visits |
| PostHog | UTC | heatmaps, dead clicks and session replay (switched on during sign-up); web vitals off | funnels are insights over past data: "/pricing → /contact → /thanks" and "/pricing → Plan selected → /checkout → Purchase" (ordered, 1-day window). Purchase a revenue event (property revenue, currency from currency); base currency left at USD |
| Mixpanel | US/Pacific → UTC | autocapture, page views, session recording 100% (set in the snippet), rage and dead clicks ($mp_rage_click, $mp_dead_click) | timezone only; funnels are reports over past data, saved on board "Click lab". The project page's "Usage Statistics" said 0 events while the Events view listed 196 for the day |
| Amplitude | UTC | currency display USD | nothing at first; funnels are charts over past data ("Contact" saved). Dead Click, Revenue, Purchase and Plan selected exist; no Rage Click event |
| Microsoft Clarity | – | "smart events" detected from the pages by itself: Submit form, Contact us, later Purchase, Order success, Checkout, Search, Outbound click | funnel Contact by page URL (a page never visited, /thanks, must be typed as a full URL); Checkout funnel on the API event Purchase (two events named Purchase sit side by side in the picker) |
| Mouseflow | – | recording (after "Activate Tracking") | funnels Contact and Checkout (pages only; Plan selected and Purchase cannot be steps). The page fields are autocomplete boxes that append instead of replacing |
| Sentry | – | errors; session replay at 100% of sessions (replaysSessionSampleRate: 1.0 in the loader) | nothing: no goals or funnels. Lab events reach it as breadcrumbs in the replay |
| LogRocket | – | session replay, rage and dead clicks (no setting for either), "block well-known bots" | conversion funnel charts Contact and Checkout (in order, single session; revenue insight from revenue in EUR). Funnels count past sessions. The step pickers take clicks on the wrong field |
| Cloudflare | UTC | page views and visits only | nothing: no goals, funnels or custom events exist |
| Privatrak | UTC (from the project wizard) | page views, clicks, form submissions, click problems, scroll depth, time on page | currency GBP → EUR; feature rules File download and Outbound link (clicks by link text; rules apply to past events too); funnels Contact and Checkout; goals Contact form sent, Plan selected, Purchase (value from detail total). Funnels count from the day they are created |
6.3 Three findings from setup
- Mouseflow records nothing from headless Chromium, even with
navigator.webdriverhidden and an ordinary user agent: its script loads and stops. The same visit in a headed window is recorded. This is why the lab ran person-like and agent-like visitors headed. - Plausible drops by reputation. Plausible answers 202 to every event and sets
x-plausible-droppedwhen it throws one away. In the 14 Nov check visit, all 6 events of a repeat buyer from one UK residential IP were dropped. Fresh IPs from the same proxy pool (T-Mobile US, Deutsche Telekom) were accepted. Of the pilot's ~28 VPN and server visits, Plausible kept 3. - Fathom misplaces Singapore. Fathom put the pilot's NordVPN Singapore visits in Brazil (7 visitors). ipinfo said Singapore and Mouseflow said Thailand. In the dashboard test, Fathom listed Brazil 20 first for 17-18 Nov, which most likely has the same cause.
6.4 The setup audit after the first day of r2 (15 Nov)
Every tool was checked again against the planned goals and funnels:
- Complete: Plausible, Umami and Matomo.
- Set up in the audit: Privatrak, LogRocket and GA4 had been missed in the first pass.
Funnels saved on 15 Nov, with day-1 numbers. The ground truth for 15 Nov was 3 contact forms sent and 3 orders, plus the 14 Nov check visit's 1 form and 1 order.
| Tool | Contact | Checkout |
|---|---|---|
| Privatrak | 16 → 3 → 3 (15 Nov) | 16 → 2 → 2 → 1 (split sessions, below) |
| PostHog | 13 → 2 → 1 persons (7 days) | 13 → 3 → 3 → 3 |
| Mixpanel (board "Click lab") | 18 → 3 → 2 (30 days) | 18 → 3 → 3 → 3 |
| Amplitude | 16 → 3 → 1 (30 days) | 16 → 3 → 3 → 3 |
| GA4 (explorations) | 23 → 6 → 4 (28 days) | 23 → 4 → 4 → 4 |
| LogRocket | 13 → 1 → 1 (last day) | built, with revenue insight in EUR |
| Mouseflow | 0 conversions (30 days of recordings) | pages only, 1 conversion |
| Umami | set up before day 1 | 11 → 3 → 3 → 3 (24 h) |
| Pirsch | set up before day 1 | 21 → 5 → 5 → 4 (7 days) |
Privatrak's undercount was the lab, not Privatrak. Privatrak's database, which we run, read in read-only mode, showed why: the buyers' page views sat in one session and their clicks, form submissions and Purchase events in another. That led to finding r2's user-agent split (chapter 4.1), which affects every IP+UA tool. Clarity had excluded 49 sessions as bots that day.
Other observations from the audit:
- Fathom's "Last 7 days" view lagged behind its "Today" view (11 against 46 visitors).
- Pirsch's goals settings page listed every goal with "0 Visitors, 0% CR" while the dashboard showed conversions.
- Mixpanel saves a report only into a board.
- GA4's funnel steps cannot filter
page_viewby a parameter before that parameter appears in processed data.
6.5 Connecting the MCP servers (19 Nov)
Every server went into one Claude Code folder (local scope), so each was connected the same way and asked by the same assistant. Steps here counts what a person has to do, from "I want my assistant to read this tool" to a connected server.
| Tool | What it took | Steps | Friction |
|---|---|---|---|
| Privatrak | claude mcp add with the URL, OAuth sign-in, pick the project at consent | 2 | – |
| PostHog | URL + OAuth | 2 | first connect timed out once |
| Mixpanel | URL + OAuth; the URL depends on the data region (EU) | 2 | the US URL for an EU project would fail |
| Sentry | URL + OAuth | 2 | answers no web-analytics questions |
| LogRocket | URL + OAuth | 2 | pricing lists MCP from the Core plan; the free plan allowed it |
| Cloudflare | URL + OAuth, choosing permissions | 2 | no Web Analytics server: the generic Cloudflare API server, which can change anything the token allows; the assistant writes GraphQL |
| Microsoft Clarity | local npx server; sign-in on first use (README) or a Data Export token (Learn page) | 2 | the two official pages disagree on auth; last 1-3 days only, 10 requests per day; the sign-in opened in two browsers |
| Matomo Cloud | enable "MCP Server" as superuser (Administration → System → General settings), create an auth token, add the URL with Authorization: Bearer | 3 | off by default; the docs don't name the header (the 401 does); Claude's apps need an OAuth client instead |
| Plausible | create a Stats API key; add Sentry's community server with the key as a header | 2 | no official server; the Stats API is a Business feature (works in the trial) |
| Pirsch | create an OAuth client (ID and secret, read access); run a community server locally | 2 | no official server; access keys (pa_) do not work |
| Google Analytics 4 | see below | 11 | by far the most |
| Umami, Amplitude, Mouseflow | not possible on our plans (Umami Pro, Amplitude Enterprise or the Plus add-on, Mouseflow Premium) | – | Mouseflow promotes its server on the free plan's start page |
| Fathom | the community server has 3 tools (account, sites, current visitors) | – | skipped: it cannot answer the questions |
GA4's official server is local only (analytics-mcp on PyPI). Google's guide lists six steps. In practice, from a Mac without the tools, it took eleven:
- Install
uv. - Install the Google Cloud CLI.
- Run
gcloud auth login. - Run
gcloud auth application-default loginwith the Analytics scope. Refused: "This app is blocked. This app tried to access sensitive info in your Google Account." Google blocks its own gcloud client for that scope on this Workspace account. The guide mentions--client-id-filewithout saying it is needed. - Create a Google Cloud project.
- Enable the Analytics Admin API and the Analytics Data API.
- Configure an OAuth consent screen (Internal).
- Create an OAuth client of type "Desktop app" and download its JSON.
- Log in again with
--client-id-file. - Set the quota project. Failed with
SERVICE_DISABLEDfor the Cloud Resource Manager API, a third API the guide does not name. Enabled it, then it worked. - Run
claude mcp addwith two environment variables (credentials path, project ID) anduvx --python 3.12 analytics-mcp.
About 25 minutes with one dead end, against 2 steps for the hosted servers.
Connection check. One read-only listing call per server, with Clarity left out to save its 10 daily calls. All ten worked. The names the lab carries in each tool differ ("Click lab", "Test", "privatrak.", "Default project", "Privatrak"). Several are the tool's own default name, so an assistant has to be told which project to read.
6.6 What each vendor documents about its MCP server
Checked on 19 Nov 2026 against the vendors' own documentation.
| Tool | Official? | Hosted / local | Auth | On our plan? | Read / write |
|---|---|---|---|---|---|
| Privatrak | yes (ours) | hosted | OAuth by URL, or API key | yes | read and setup; setup runs with undo |
| Google Analytics 4 | yes | local (analytics-mcp) | Google Application Default Credentials | yes (needs a Google Cloud project) | read-only by default; 3 write tools behind --allow-write |
| Plausible | no, community (Sentry's, listed in Plausible's docs) | hosted or local | Stats API key as Bearer | yes in the trial (Business feature) | read-only |
| Fathom | no, community | local | API token | probably | read (3 tools) |
| Simple Analytics | yes | hosted | OAuth | yes, every plan including Free | read and write (53 tools) |
| Umami Cloud | yes (since 2026-09-10) | hosted or local | Cloud API key | no: Pro and up | read-only, 23 tools |
| Pirsch | no, community (listed in Pirsch's docs) | local | OAuth client ID and secret | API on all plans | read-only, 3 tools |
| Matomo Cloud | yes | hosted on the instance | OAuth client or auth token | yes (superuser must enable) | read by default; writes if allowed |
| Cloudflare | yes, but generic (whole Cloudflare API) | hosted | OAuth or API token | yes | read and write (any API call) |
| PostHog | yes | hosted | OAuth or personal API key | yes | read and write; read-only switch |
| Mixpanel | yes | hosted (US, EU, IN URLs) | OAuth | yes for free accounts created after 2026-08-01 | read and write, 73 tools |
| Amplitude | yes | hosted (US, EU) | OAuth | no: Enterprise, or Plus as an add-on | read and write |
| Microsoft Clarity | yes | local (npx) | OAuth (README) or Data Export token (Learn page) | yes | mostly read; topic insights write |
| Mouseflow | yes | hosted; legacy local | Mouseflow login | no: Premium and up | read-only, 21 tools |
| Sentry | yes | hosted | OAuth | yes ("MCP access" on Developer) | read and write (issue triage) |
| LogRocket | yes | hosted | OAuth or project API key | unclear in pricing; worked on Free | 9 query tools |
7. Dashboard answer test (20 Nov)
The ten questions of the MCP test (chapter 8), about 17 and 18 Nov in UTC days, asked in each tool's own dashboard on 20 Nov, 04:30-06:40 UTC, the lab's last day. Scoring (verdicts, steps, findability 1-5) is defined in chapter 3.9; expected numbers are each tool's delivered visits (chapter 5.2).
Three rounds.
- The first covered Privatrak and Google Analytics, the second the other nine of the MCP test's tools.
- A third round (05:55-06:40 UTC) finished Mixpanel and LogRocket and added three of the four lab tools that are not in the MCP test: Fathom, Amplitude and Mouseflow.
- Umami seemed signed out all along, but wasn't: Umami Cloud's start page
(
cloud.umami.is) and/settingssend you to the login page even when you are signed in. The dashboard atcloud.umami.is/analytics/us/…opens without a new login. It was asked last.
One stray visit on 20 Nov. At about 05:01 UTC, clicking the site's name in
Cloudflare's site list opened clicklab.privatrak.com itself in a new tab. It
was closed at once, but it is a real visit (Chrome on macOS, no #r= label). LogRocket shows it as a 1-event session from
Thailand. It falls on day 4, not 17-18 Nov.
7.1 How it ran
- Each question was answered from the tool's start page, the way a person
would, using the tool's own reports. Where a question needed a report that
didn't exist yet, it was built and named
UI test: …. - Steps are the screens and clicks from the start page to the number.
- Findability is scored 1-5 as defined in chapter 3.9. Each score under 5 says why.
- Expected numbers are the per-tool delivered visits from the MCP test's
ground truth (requests to that tool answered 2xx).
- Privatrak: 72 visitors (71 person-days plus the unknown visitor) and
200 page views (199, one lost at a visit's end, plus two not in the
records; checked event by event, chapter 5), funnel 23 → 4 → 4, 4 downloads, 7 outbound clicks,
5 views of
/templates, 7 purchases for 56 EUR, "Duplicate form" 4 rage clicks and 7 dead clicks. - GA4: see below. Its property runs on Los Angeles time, so its "17-18 Nov" is a different window.
- Privatrak: 72 visitors (71 person-days plus the unknown visitor) and
200 page views (199, one lost at a visit's end, plus two not in the
records; checked event by event, chapter 5), funnel 23 → 4 → 4, 4 downloads, 7 outbound clicks,
5 views of
7.2 At a glance
✓ answered and close to the expected number · ≈ answered, but another
metric, another window or a gap · ✗ answered and wrong · – the tool cannot
answer · · not checked (time). The number after each mark is findability
(1-5).
| Tool | Q1 visitors, views | Q2 sources | Q3 France | Q4 time on /article | Q5 funnel | Q6 PDF | Q7 outbound | Q8 rage/dead | Q9 404 | Q10 purchases, revenue |
|---|---|---|---|---|---|---|---|---|---|---|
| Privatrak | ✓ 5 (views 3) | ✓ 5 | – | ≈ 4 | ✓ 5 | ✓ 4 | ≈ 4 | ✓ 5 | ✓ 4 | ✓ 5 (revenue ≈ 2) |
| Plausible | ✓ 5 | ✓ 5 | ✓ 4 | ✓ 4 | ≈ 4 | ✓ 5 | ✓ 5 | – | ✓ 5 | ✓ 5 |
| Pirsch | ≈ 4 | ✓ 5 | ✓ 4 | ✗ 3 | ✓ 4 | ≈ 5 | ✓ 5 | – | ✓ 5 | ✓ 5 (revenue ≈ 2) |
| Matomo | ≈ 4 | ≈ 4 | ✓ 4 | ✗ 4 | ≈ 4 | ≈ 5 | ≈ 5 | – | ≈ 4 | ≈ 4 |
| PostHog | ≈ 4 | ✓ 4 | ✓ 4 | ✓ 2 | ≈ 4 | ✓ 2 | ≈ 4 | ≈ 4 | ✓ 3 | ✓ 2 |
| Mixpanel | ✓ 3 | ≈ 3 | ✓ 3 | – | ≈ 4 | ✓ 3 | ≈ 3 | ✓ 3 | ✓ 3 | ✓ 3 |
| GA4 | ≈ 4 | ≈ 3 | ≈ 4 | ≈ 3 | ≈ 2 | ≈ 3 | ≈ 3 | – | ≈ 4 | ≈ 3 |
| LogRocket | ✓ 3 | ≈ 2 | ✓ 3 | – | ≈ 3 | ✓ 3 | ✓ 3 | ≈ 3 | ✓ 3 | ≈ 3 |
| Cloudflare | ✓ 4 | ✓ 4 | ✓ 4 | – | – | – | – | – | ✓ 3 | – |
| Sentry | – | – | – | – | – | – | – | ≈ 4 | – | – |
| Clarity | ≈ 4 | ≈ 3 | ✗ 4 | ≈ 2 | ≈ 4 | – | ≈ 4 | ≈ 3 | ≈ 4 | ≈ 4 |
| Fathom (no MCP) | ≈ 5 | ✓ 5 | ≈ 4 | – | – | – | – | – | ✓ 5 | ✓ 5 |
| Amplitude (no MCP on our plan) | ≈ 4 | ≈ 2 | ≈ 2 | ✗ 3 | ≈ 3 | ✓ 2 | ≈ 2 | ≈ 2 | ≈ 4 | ✓ 2 |
| Mouseflow (no MCP on our plan) | ≈ 5 | – | ≈ 4 | ≈ 4 | ✗ 4 | · | · | ≈ 3 | ≈ 4 | ≈ 3 (revenue –) |
| Umami (no MCP on our plan) | ✓ 5 | ✓ 4 | ✓ 4 | ✗ 4 | ✓ 5 | – | – | – | ✓ 4 | ✓ 5 (revenue 3) |
Per-tool expected numbers (delivered visits 17-18 Nov UTC; upper bounds for consent-gated tools; the three page loads not in the records can add up to 2 visitors and 7 page views, chapter 5):
| Tool | Person-days | Page views | France | Funnel | Outbound | 404 | Purchases | |
|---|---|---|---|---|---|---|---|---|
| Plausible (non-Chromium only) | 26 | 71 | 2 | 5 → 1 → 1 | 3 | 4 | 3 | 3 |
| Pirsch | 68 | 194 | 11 | 22 → 4 → 4 | 4 | 6 | 5 | 7 |
| Matomo | 58 | 150 | 9 | 19 → 3 → 3 | 3 | 4 | 4 | 5 |
| PostHog | 50 | 126 | 7 | 13 → 2 → 2 | 4 | 4 | 4 | 3 |
| Mixpanel | 52 | 138 | 7 | 18 → 2 → 2 | 3 | 3 | 4 | 5 |
| LogRocket | 67 (97 visits) | 192 | 11 | 22 → 4 → 4 | 3 | 5 | 5 | 7 |
| Cloudflare | 95 visits | 190 | 18 visits | – | – | – | 5 | – |
| Sentry | 77 visits | 146 | 13 visits | – | – | – | 4 | 5 |
| Clarity | 84 visits | 176 | 14 visits | 22 → 4 → 4 | 3 | 4 | 5 | 7 |
| Fathom | 68 | 194 | 12 (19 visits) | 22 → 4 → 4 | 4 | 6 | 5 | 7 |
| Amplitude (consent) | 60 | 164 | 10 | 20 → 4 → 4 | 3 | 3 | 5 | 5 |
| Mouseflow | 58 (82 visits) | 165 | 9 | 16 → 3 → 3 | 3 | 5 | 5 | 5 |
| Umami | 66 (83 visits) | 164 | 11 (15 visits) | 20 → 3 → 3 | 2 | 4 | 4 | 7 |
GA4's row is ≈ for the same reason as in the MCP test: the interface has no way to choose UTC days. Against its own window its numbers are close (below).
7.3 Privatrak
The start page is the Overview, with a date picker at the top right. Picking 17 → 18 Nov took two clicks. The range carries over when you move through the sidebar. Opening a report by its URL resets it to the last 7 days.
- Q1 Visitors 72, page views 200 (expected 72 and 200).
- Visitors are a key number on the Overview: 1 screen, 2 clicks.
- The page-view total is not on the Overview: Insights gives it (a count of page views over the range), and the Pages list's 15 rows add up to the same 200. Findability 3: a query to build, or a column to add up.
- Q2 LinkedIn 11, Google 8, DuckDuckGo 7, Product Hunt 7, direct 6
(expected LinkedIn 11, then 8 each; direct 26, see below). This is the
Overview's "Top sources" card, the same screen as Q1.
- "Direct or unknown 6" is low against 26 because Privatrak counts a visitor's source from their first page view of the day. Most lab visits came with a referrer, and the "direct" personas returned on other days with one.
- The MCP answer gave the same 6.
- Q3 not possible: no geodata, by design.
- Q4
/article1m 1s (77 s wall-clock time per view expected). This is the Time on page column in Pages: 1 click. Findability 4: the page doesn't say this is active time (tab visible, recent input), only the docs do. That is why it is shorter than the time between page views. - Q5 Contact funnel 24 → 4 → 4 (23 → 4 → 4; the new-tab link from
/labadds one to the first step). Funnels → Contact: 2 clicks. The funnel detail follows the selected range.- The funnel list does not: it shows each funnel's own 31-day window (Contact: 75 entering, 16 completing), with no label saying so. That is easy to misread as the selected period.
- Q6 File download 4 (4) and Q7 Outbound link 6: ≈ (7: one Firefox visit lost its leave-time send, known from day 2). Both are in the Overview's "Top features" card. Findability 4: they show only because features with those names were set up before the series. With no setup, the clicks are in Events but not named.
- Q8 "Duplicate form": 7 no effect, 4 repeated clicks (7 dead, 4 rage). This is the Overview's "Click problems" card, same screen. Findability 5: the element is named by its text, with the page.
- Q9
/templates5 views (5). In Pages. Findability 4: nothing marks the page as a 404, so you have to know the path. That is the gap noted for the product (404 detection). - Q10 Purchase 7 (7), in the Overview's "Top features". Revenue 56
(56 EUR) only through Insights: Show → Sum → detail
total→ Run → "Single value", 6 clicks, no currency shown. Findability 2.- The Purchase goal has no value set, so Sources shows "–" for revenue. Choosing a detail as the value would count only from today, not 17-18 Nov.
- Sources with the Purchase goal shows conversions only on rows with a source (1 each for LinkedIn, Product Hunt, direct and Bing = 4). The 3 others did not land on a row there.
7.4 Google Analytics 4
The property is on America/Los_Angeles, and every report and exploration uses the property's day. "17-18 Nov" is therefore 17 Nov 08:00 UTC to 19 Nov 08:00 UTC. That window includes day 3's visits (19 Nov, 06:05 UTC) and the manual round (19 Nov, 07:12-07:20 UTC, from Thailand). It leaves out day 1's main round (17 Nov, 05:00-06:30 UTC).
The expected numbers for that window come from the manifest: 38 delivered visits, 23 personas, 92 page views. The manual round adds 3-4 users and about 17 page views.
- Q1 28 active users, 105 views (about 26-27 users and about 109 page views). Reports → Engagement → Pages and screens, then a custom range: 4 clicks. The Events report says 30 "total users" for the same range: two user counts on neighbouring screens. Findability 4.
- Q2 Sessions by source: google 7, linkedin.com 7, (direct) 6, reddit.com 4, bing 3. Reports → Acquisition → Traffic acquisition, then switch the table's dimension from "Session primary channel group" to "Session source": 5 clicks. Findability 3: the default table shows channel groups (Organic Social 17, Organic Search 10), and the source is one dimension switch away.
- Q3 France 4 active users. Reports → User → Demographic details: 3 clicks. Thailand 3 is the manual round, which confirms the window. Findability 4.
- Q4
/article1m 07s. This is the "Average online active user engagement time" column in Pages and screens: engagement time per active user, not per view (11 users, 16 views; 77 s wall-clock per view expected). Findability 3: the metric name doesn't say per user, and there is no time-on-page metric. - Q5 13 → 1 → 1 active users (window: 14 → 1 → 1 from the manifest,
plus up to 4 manual
/pricingvisits).- The existing exploration "Contact" was on the last 28 days, and changing its range would have saved over it. So a new one was built: Explore → Funnel exploration template → rename → date → edit steps.
- Each step: remove the template's event, search "page path", pick "Page path and screen class", add filter "contains /pricing", rename the step.
- Then remove the template's fourth step and apply. About 30 clicks.
- Findability 2: funnels exist only as explorations, not reports, and the steps can't be typed as paths.
- Q6 file_download 1, Q7 click 2. Reports → Engagement → Events, page 2
of the table: 3 clicks. The rows give counts only. Seeing that the clicks
went to w3.org or the PDF needs the event's parameters (
link_url), one drill-down further. Findability 3. The window expects 2 downloads and 3 outbound clicks. - Q8 not possible: GA4 records no rage or dead clicks.
- Q9
/templates3 views (3). In Pages and screens. Findability 4: no 404 marker, but the page title column would show "Page not found". - Q10 purchase 3, total revenue $26.44. In Events (and on the Home
page's "Purchases" card for the default range). The window expects 5
purchases.
- The site sends EUR. GA4 shows revenue in the property's currency (USD), converted: 3 × 8 EUR = 24 EUR ≈ $26.44.
- Findability 3: the number is there, but in another currency without a word about it.
7.5 Plausible
The site dashboard takes a custom range (period=custom&from=…&to=…) and is
on UTC. Everything is on one page in tabbed boxes, so most answers are one
click from the start page.
- Q1 31 unique visitors, 31 visits, 77 page views (expected 26 person-days and 71 page views; only the non-Chromium visits are kept). The top row of the dashboard. Findability 5.
- Q2 Direct 5, Google 5, LinkedIn 4, DuckDuckGo 3, Perplexity 3. The Sources tab, 1 click. The default tab is Channels (Organic Social 10). Findability 5.
- Q3 France 2 (2). The Countries tab of the map box. Findability 4: the box opens on the map.
- Q4
/article1m 06s (79 s wall-clock). Expand Top pages to get the Time on page and Scroll depth columns. Findability 4: the columns are only in the expanded view. - Q5 8 → 1 → 1, "3-step funnel, sequential". From the Funnels drop-down
in the goals box, the existing "Contact" funnel. Findability 4.
- 8 is the number of visitors with a
/pricingview; the expected 5 counts only the funnel-shaped visits, so it is ≈.
- 8 is the number of visitors with a
- Q6, Q7, Q9, Q10 in the Goals tab, one click:
- File Download 3 (3), Outbound Link: Click 4 (4), 404 3 (3).
- Purchase 3 (3) with revenue €24.0, average €8.0. Findability 5 each.
- Q8 not possible: no rage or dead clicks.
- Operating systems says "Mac 31, 100%". Most likely all the WebKit and Firefox personas Plausible kept use macOS user agents. This wasn't checked against the manifest.
7.6 Pirsch
No UTC days in the UI. The dashboard uses the domain's timezone
(Asia/Bangkok). The range picker has date fields, and Start/End Time fields
only for a single day. URL parameters were rewritten to one day. So "17-18
Nov" here is 16 Nov 17:00 to 18 Nov 17:00 UTC, which leaves out the
before-midnight visits of 18 Nov. The MCP server took timezone=UTC, so its
answers were UTC days.
- Q1 62 visitors, 193 page views, 77 sessions (UTC: 68 person-days, 194 page views). The top row. Findability 4: the timezone is not shown, only the hourly chart's peak at "12:00 PM" gives it away.
- Q2 LinkedIn 10, Google 9, DuckDuckGo 7, Hacker News 7, Reddit 7, producthunt 7, Direct / None 6. The Referrers box, no click. Findability 5.
- Q3 France 11 (11). The Countries box. Findability 4.
- Q4
/article18m 16s: wrong (77 s). Expand the Pages box to get the Time on page column.- It is the MCP's 1,096 s exactly, so the error is Pirsch's data, not the
server.
/thanksshows 16m 20s and/search15m 0s too. - Findability 3.
- It is the MCP's 1,096 s exactly, so the error is Pirsch's data, not the
server.
- Q5 Pricing 23 → Contact 4 → Thanks 4 (22 → 4 → 4). Funnels → Contact,
2 clicks. This works in the UI, while the MCP server's
funnelsmetric answered "not found" twice. Findability 4. - Q6 File Download 3 (4), Q7 Outbound Link Click 6 (6), Q9 404
Page Not Found 5 (5), Q10 Purchase 7 (7). All in the Events box, no
click. Findability 5.
- Revenue: only as event metadata. Expand Events → Purchase →
revenueshows the value "8" on 7 events, so the total (56) is your own multiplication. Findability 2. - A click on an event name sets a dashboard-wide filter that follows you to the Funnels page.
- Revenue: only as event metadata. Expand Events → Purchase →
- Q8 not possible.
7.7 Matomo Cloud
A range is period=range&date=2026-11-17,2026-11-18 in the URL, or the
calendar. The site is on UTC.
- Q1 49 visits, 103 page views. Visitors → Overview, 1 click. Findability 4: unique visitors are not offered for a range. Matomo counted 49 of the 78 visits it was sent, as in the MCP test.
- Q2 Channel types: Social Networks 17, Search Engines 13, Direct Entry 7,
AI Assistants 6, Campaigns 6. Referrers: "Keyword not defined" 13, then
LinkedIn 7.
- Acquisition → All Channels. The UI shows direct entry as its own row, where the MCP assistant had to infer it as a remainder.
- Findability 4: the search engines hide behind the keyword row.
- Q3 France 10 visits (9 person-days expected; 13 visits delivered). Visitors → Locations. Findability 4.
- Q4
/article00:03:55 = 235 s: wrong (77 s). Behaviour → Pages./thanksshows 17:33 and/templates8:38, so Matomo's time on page runs long here./article?ref=producthuntis a separate row: query strings are not stripped by default.- Findability 4.
- Q5 14 → 1 → 1. Funnels → "Visit /thanks", 2 clicks (19 → 3 → 3 delivered). Findability 4.
- Q6 downloads 2, Q7 outlinks 1 (3, 4). On the Visits Overview and as goals. Findability 5.
- Q9
/templates2 views (4). Findability 4. - Q10 4 orders, €32. Ecommerce → Overview. Findability 4. MCP: the same.
- Q8 not possible: heatmaps exist, but no rage or dead clicks per element.
7.8 PostHog
Web analytics takes date_from/date_to and is on UTC.
- Q1: two answers on one screen.
- The headline tiles say 39 visitors, 76 page views, 40 sessions.
- The tables below the tiles add up to 41 visitors and 106 page views
(Paths and Device type). A trends insight agrees with the tables: 106
$pageview, 41 unique users. - 38 personas and up to 126 page views were delivered.
- Findability 4. The headline is what a person reads first, and it is the lower one.
- Q2 $direct 14, linkedin.com 7, duckduckgo.com 6, google.com 5, perplexity.ai 4. Switch "Sources by Channel" to Referring domain. Findability 4.
- Q3 France 6 (7 person-days). Switch "Geography by Map" to Countries. Findability 4.
- Q4 59.44 s. Not in web analytics or the page report.
- Only a trends insight gives it: average of
$prev_pageview_durationon$pageleave, filtered to/article. The MCP's first number was the same. - Findability 2.
- Only a trends insight gives it: average of
- Q5 11 → 0 → 0. The saved "MCP test: contact funnel" insight with a
fixed 17-18 Nov range (not saved). PostHog has no
/contactor/thankspage view on those days, as the MCP test found. Findability 4. - Q6 3 autocapture clicks on the checklist link, via a trends insight. Findability 2.
- Q7 w3.org 2 clicks. The page report for
/articlehas an Outbound Clicks table. Findability 4. - Q8 page level only: "Frustrating pages" shows
/labwith 3 rage clicks and 11 dead clicks. Element level needs the heatmap toolbar on the site itself. Findability 4. - Q9 3
not_foundevents (and 3 views of/templates). Findability 3. - Q10 3 purchases, revenue 24.
- A trends insight summing
revenueon Purchase. Summingtotalgave 0: the property's name has to be known. - Findability 2.
- A trends insight summing
- Nothing was saved. The insights were built from the trends editor and left unsaved.
7.9 Mixpanel
There is no traffic overview: every answer is a report built in Insights. Each one takes the same steps:
- Custom date (the natural-language box understands "Nov 17, 2026 to Nov 18, 2026"; it then offers the range under "Recently applied").
- Pick the event, set Unique users or Total events, and choose "Metric" as the chart type.
- Add a breakdown.
About 6-10 clicks per question. The project is on UTC. Nothing was saved: the report stayed "Untitled".
- Q1 40 users, 124 page views (39 personas and 52 person-days, 138 page views delivered). [Auto] Page View as Unique users, then Total events. Findability 3: there is no traffic overview without building a report.
- Q2 by referring domain: clicklab.privatrak.com 20, (not set) 19,
google.com 8, reddit.com 7, linkedin.com 6.
- The site itself is the top "source", and direct traffic is "(not set)".
- There is no source or channel property beside Referring Domain and Initial Referring Domain.
- Findability 3.
- Q3 France 5 (7 person-days). Breakdown by Country. Findability 3.
- Q4 not possible: autocapture records no time on page.
- Q5 13 → 2 → 2 (18 → 2 → 2). The day-0 board "Click lab", with the
board's date set to 17-18 Nov.
- Changing a board's date puts the board into edit mode with Save/Cancel. It was cancelled.
- The MCP assistant built a new funnel and got 13 → 1 → 1.
- Findability 4.
- Q6 3 clicks on
/mapleform-checklist.pdf(3) and Q7 1 click onhttps://www.w3.org/WAI/tutorials/forms/(up to 3).- [Auto] Element Click, broken down by "[Auto] Link target", whose
description says it is the element's
href. - The property list offers no "href" or "text": searching "href" finds nothing, so you have to know the link's address is called "Link target".
- Findability 3.
- [Auto] Element Click, broken down by "[Auto] Link target", whose
description says it is the element's
- Q8 by element ID: [Auto] Dead Click:
b11,a4, (not set) 17. [Auto] Rage Click:b1.bis the "Duplicate form" button. There is no text or selector property, so the ID is the only way to tell elements apart.- The counts cover all pages: there is no /lab filter without adding one.
- Findability 3.
- Q9 3 views of
/templates(up to 4). [Auto] Page View broken down by Current URL, filtered in the table's search. The URLs in that table are live links to the site and were not clicked. Findability 3. - Q10 5 purchases, sum of
amount40 (5, 40 EUR). The Purchase event, then Aggregate Property → Sum →amount, with no currency. Findability 3. - Mixpanel's home page says "No users seen in the last week" and "No events found", with lab events arriving all week. It reads like an empty project.
7.10 LogRocket
The session list is the analytics tool.
- Session Replay has its own timezone switch (GMT+7 or UTC) and a custom range.
- Each "Add Session Filter" gives the matching session count ("Showing 1-10 of N").
- The filter goes into the URL, so a question is one filter.
The dashboards are less useful: their KPI tiles show only the last day of the range, and they have no totals.
- Q1 97 sessions (97 visits: exact). The session list with 17-18 Nov in UTC. There is no visitor count and no page view total. Findability 3.
- Q2 one source at a time: "Referrer URL contains linkedin" gives 11 (11). There is no list of sources to rank. Findability 2.
- Q3 France 18 sessions (18 visits: exact). Filter Country is France. Findability 3.
- Q4 not possible: only "Average Session Duration" on the Analytics dashboard. Time on page exists only as a condition inside "Visited URL" (default "time on page greater than 1 s").
- Q5 per page: visited
/pricing25,/contact4,/thanks4 sessions (22 → 4 → 4). An ordered funnel would need a Conversion Funnel chart, which wasn't built. Findability 3. - Q6 3 sessions clicked text containing "checklist" (3) and Q7 5 clicked "forms tutorial" (5). Filter Clicked, by text: you need the link's text, not its URL. Findability 3.
- Q8 Dead Clicked "Duplicate form": 7 sessions (7 visits). Rage Clicked (any): "No sessions found" (4 rage visits sent). Findability 3.
- Q9 Visited URL contains
/templates: 5 (5). Findability 3. - Q10 7 sessions visited
/order-complete(7). The revenue (therevenueproperty on the Purchase event) has no sum in the session list. Findability 3. - The "Most Rage Clicked Elements" widget on Home says "No data found" for the same days.
- Visitors are labelled by city, and one session by its full IP address (in the sessions list). Sentry does the same. See below.
7.11 Fathom (no MCP comparison)
Fathom has only a community MCP server with three tools (account, sites, current visitors), which cannot answer any of the questions, so there is no MCP answer to compare with.
The account has one site, named "Privatrak", which is the lab site. The date
picker sets from=2026-11-17 00:00:00&to=2026-11-18 23:59:59 in UTC.
Everything is on one page.
- Q1 71 site visitors, 174 page views (68 person-days, 194 page views). Findability 5. Page views are 20 short of what was delivered.
- Q2 Direct / Unknown 19, LinkedIn 11, Google 8, DuckDuckGo 7, news.ycombinator.com 5 (direct 25, LinkedIn 10, DuckDuckGo 8). The Referrers tab (the box opened on "AI"). Findability 5.
- Q3 France 15 (12 person-days, 19 visits). The Countries box.
- It lists Brazil 20 first, though no persona was set in Brazil. This wasn't checked against the exit IPs.
- Findability 4.
- Q4 not possible: only "Avg time on site 00:59", no time per page.
- Q5 not possible: no funnels.
- Q6, Q7 not possible as set up: Fathom counts only events the site sends, and the lab sends Fathom only Plan selected, Purchase and 404.
- Q8 not possible.
- Q9 "404: /templates" 5 (5). The Events box. Findability 5.
- Q10 Purchase 7, value €56 (7, 56 EUR). Findability 5.
7.12 Amplitude (no MCP comparison)
Amplitude's MCP server needs Enterprise or the Plus add-on, which our plan doesn't have.
The login opens on app.amplitude.com, not the EU host. Marketing Analytics has a ready web dashboard. Its date picker shows "UTC+00:00", and the URL takes the UTC range.
Amplitude records only after consent, so the expected numbers are upper bounds.
- Q1 39 visitors, 54 sessions, 131 page views (up to 60 person-days and 164 page views). Traffic by Channel and Page Engagement. Findability 4.
- Q2 Default channels: Organic Search 13, Organic Social 13, Direct 9.
- The dashboard's breakdown offers only Default Channels.
- Sources need a chart grouped by
referring_domain. Summed over the two days: (none) 8, LinkedIn 7, Google 7, Reddit 6, DuckDuckGo 6. - Findability 2.
- Q3 France 8 (5 on 17 Nov + 3 on 18 Nov, unique users per day; up to 10 person-days). Chart grouped by Country. Findability 2.
- Q4
/article"Time Spent Per Page" 18m 45s: wrong (73 s). Page Engagement, per page path./search15m 3s and/templates8m 37s show the same inflation. Findability 3. - Q5 15 → 1 → 0 (up to 20 → 4 → 4). The saved "Contact" funnel chart, with its date changed to 17-18 Nov and not saved. Findability 3.
- Q6 3 "Download the checklist (PDF, 2 KB)" (3) and Q7 2 "forms tutorial" (up to 3). Element Clicked grouped by Element Text, in a new chart. Findability 2.
- Q8 Dead Click by Element Text: Duplicate form 5, Delete form 2, Save
draft 2, Publish form 1. Up to 6 dead "nothing" visits were sent.
- There is no rage click event to choose.
- Findability 2.
- Q9
/templates3 page views (5). Page Engagement. Findability 4. - Q10 Purchase 5, revenue 40 (5, 40 EUR). The Revenue event, Sum of
Property Value on
$revenue. The property first defaulted to$currency, which gives 0. Findability 2. - Charts have no total column: a breakdown shows a "Row Average" and the two days, so every total is added up by hand.
7.13 Mouseflow (no MCP comparison)
Mouseflow's MCP server needs the Premium plan, which ours isn't.
The site's tile in "Manage My Sites" links into the tool. The date picker
writes fromdate/todate into the URL.
- Q1 40 visitors, 55 sessions, 111 page views (82 visits, 165 page views delivered). The dashboard's top row. Findability 5. It counts only recorded sessions.
- Q2 not found: the dashboard's "Visitor sources" section has only Average Visit Duration.
- Q3 France 5 (9 person-days). "No. of Visitors by Country" is a bar chart without numbers, read off the bars. Findability 4.
- Q4
/articlevisit time 47.3 s, engagement 43.1 s (77 s). The Heatmaps list. Findability 4. - Q5 Contact funnel 0 (0%) (16 → 3 → 3): no
/contactor/thankspage view is among the recorded pages. Findability 4. - Q8 friction: "Average click Rage events 0"; dead-click on 2 page views;
/labfriction score 0.5. Findability 3. - Q9
/templates3 views (5); the friction list counts "404" on 6 page views. Findability 4. - Q6 and Q7 not answered. Mouseflow has no download or outbound-click
report. The Heatmaps list counts 12 clicks on
/article, not split by link. Only the click heatmap of/articlewould show the PDF and w3.org links. Its viewer renders the page itself, so it wasn't opened, to keep stray requests off the lab site. - Q10 Purchase tag on 2 recorded sessions, "order placed" on 1, no
revenue (5 purchases delivered, €40). Session Replay → Filters → Tag
"Purchase", or Filters → "Order placed | revenue" → Event occurred.
Findability 3. The "order placed" session shows
plan=Teamand anorder_id, but no amount. It counts only recorded sessions, like Q1. - Times are UTC: the session list puts the 17 Nov morning run at 05:xx and the midnight round at 23:44 and 00:06.
7.14 Umami Cloud (no MCP comparison)
Umami's MCP server needs the Pro plan; ours is free.
Getting in. Umami Cloud's start page and its settings page show the
login form even when you are signed in. The dashboard URL
(cloud.umami.is/analytics/us/websites/…) opens without one. The earlier
rounds took the login form at face value.
The window. The date picker (Custom range, 17 → 18 Nov) gives UTC days.
The hourly bars show the 64 visits of 05:00 UTC on 17 Nov at "5 AM", and the
four /templates views at the times they were made. The URL, though,
carries the browser's midnights (UTC+7):
range:1794848400000:1795021199999 is 16 Nov 17:00 to 18 Nov 16:59 UTC.
Rewriting it to UTC midnights shifted the window seven hours later (38
visitors, 99 views, the 19 Nov run included). So: use the picker, never
edit the URL.
- Q1 64 visitors, 71 visits, 166 page views (66 person-days, 83 visits, 164 page views). The top row of the Overview. Findability 5.
- Q2 linkedin.com 10, chatgpt.com 7, reddit.com 7, news.ycombinator.com 7,
google.com 6, duckduckgo.com 6 (LinkedIn 10, Hacker News, ChatGPT and
Reddit 7 each, DuckDuckGo 6: exact). The Sources box, same page.
- Direct visits aren't in Referrers. The Channels tab next to it shows Organic social 23, Direct 20, Organic search 13, LLM 8, Email 4 (direct 23 delivered).
- One
app.privatrak.comreferrer. - Findability 4: the direct count needs the second tab.
- Q3 France 12 visitors (11 person-days, 15 visits). The Location box. Findability 4.
- Q4 wrong: "Visit duration 0s" with the filter Path is
/article(expected 72.8 s mean on 16 views; the 16 views themselves are exact).- Umami has no time on page. Visit duration is measured between page
views, and 15 of the 16 visits saw only
/article(bounce rate 94%), so it comes out as 0. - Findability 4 for a number that means something else.
- Umami has no time on page. Visit duration is measured between page
views, and 15 of the 16 visits saw only
- Q5 Contact funnel 22 → 3 → 3 (20 → 3 → 3). The Funnels page lists the
"Contact" funnel built during setup, with the picker's range. Findability 5.
- The "Checkout" funnel beside it:
/pricing22 → Plan selected 7 →/checkout7 → Purchase 7.
- The "Checkout" funnel beside it:
- Q6 and Q7: no answer. Umami records page views and the events the site sends. It doesn't capture file downloads or outbound clicks by itself, and the lab sends it only Plan selected and Purchase (Events: 7 and 7).
- Q8: no answer. No rage or dead clicks. Heatmaps and Replays need the Business plan.
- Q9
/templates4 views (4: exact). The Overview with the filter Path is/templates. Findability 4: you have to know the path. Umami doesn't mark 404s. - Q10 7 orders, €56.00 (7 purchases, €56: exact). The Revenue page.
- The page opens in USD and shows "$0.00, 0 orders". Only after switching the currency to EUR do the numbers appear. That looks like no revenue, not like a currency filter: findability 3 for revenue.
- Purchases alone: Events or Goals, findability 5.
- Revenue per referrer and country comes with it (reddit.com €16, France €16).
7.15 Cloudflare Web Analytics
The time picker is in the browser's timezone, but its absolute range takes
times. "17 Nov 07:00 to 19 Nov 07:00 (GMT+7)" is exactly the UTC window (the
URL then reads time=2026-11-17T00:00:00Z/2026-11-19T00:00:00Z).
- Q1 95 visits, 196 page views (95, 190). Web Analytics → "View Web Analytics for all sites". There are no visitors, only visits. Findability 4.
- Q2 None (direct) 36, google 9, linkedin 9, reddit 8, duckduckgo 8. The Visits view. Findability 4.
- Q3 France 19 visits (18). Findability 4.
- Q9
/templates5 (5). The Page views view, with the paths list switched from 5 to 15 items. Findability 3. - Q4-Q8 and Q10 are not possible: no events, time on page or funnels.
- In the site list, the site's name is a link to the site itself, not to its report. That is how the stray visit on 20 Nov happened.
7.16 Sentry
Session Replay takes an exact UTC range (start, end, utc=true).
- Q8 "Most Dead Clicks: button#b 3, a 1"; "Most Rage Clicks: no results".
These are widgets on top of the replay list: 1 click from the start page.
button#bis the "Duplicate form" button.- It is sampled replays, not all visits (B-nothing: 5 delivered).
- Findability 4: the element is a selector, not its text.
- Everything else is not possible: no traffic, sources, pages, funnels or events. The replay list could be filtered and counted by hand, which is what the Claude Opus run of the MCP test (chapter 8) did.
- The replay list labels each replay by the visitor's full IP address.
7.17 Microsoft Clarity
The dashboard's "Customised" range works in the browser's timezone, but the URL takes millisecond timestamps. With 17 Nov 00:00 UTC to 18 Nov 23:59 UTC the dashboard shows "11/17/2026 07:00 - 11/19/2026 06:59".
- Q1 112 sessions, 108 unique users, pages per session 1.14 (84 visits,
176 page views delivered). "46 bot sessions excluded". There is no page view
total; the Top pages add up to about 128.
- Clarity has more sessions than visits it was sent. That is the same as the MCP answer (112), so it is Clarity's own sessioning.
- Findability 4.
- Q2 clicklab.privatrak.com 43, www.reddit.com 11, www.linkedin.com 10, chatgpt.com 9, www.google.com 8. The Referrer box. The site's own domain is the top "referrer", and direct is not a row. Findability 3.
- Q3 France 25 sessions: wrong (14 visits). Region tab. Findability 4. For 17-19 Nov the MCP gave 29.
- Q4 not per page: "Active time spent 19 sec" is for all sessions. A
filter to sessions that visited
/articlewould still be per session. Findability 2. - Q5 Contact: 15 → 0 → 0 (22 → 4 → 4). The Funnels box. Findability 4.
- Q7 Outbound click 3 sessions (4), Q10 Purchase 4 sessions (7, no revenue). Both under Smart events. Findability 4.
- Q6 not possible: no download event.
- Q8: Heatmaps →
/lab→ "Dead clicks" (desktop) ranks the paragraph text 3, the chart 1 and "Open pricing in a new tab" 1. "Rage clicks" finds none.- "Duplicate form" (11 clicks) is not flagged as dead, though its clicks do nothing.
- Findability 3.
- Q9
/templates4 (5). Top pages. Findability 4.
7.18 Dashboard against MCP, tool by tool
- Privatrak: every number is the same in the dashboard and through MCP:
72 visitors, 200 page views, LinkedIn 11 and direct 6, 61 s, 24 → 4 → 4,
4 downloads, 6 outbound clicks, "Duplicate form" 7/4, 5 views of
/templates, 7 purchases for 56. That's expected, since the MCP tools call the same API routes.- Revenue takes an insights sum in both: the MCP assistant built the same query.
- The page-view total comes from Insights in both: the assistant asked insights for the count, as a person would in the dashboard.
- Plausible: the same numbers, and two answers the server could not give.
- The UI shows revenue (€24) where every revenue call through the community server failed on a schema error.
- The UI has the ordered funnel (8 → 1 → 1), which the Stats API doesn't offer.
- Pirsch: the funnel works in the UI (23 → 4 → 4) where the server's
funnelsmetric failed.- The UI cannot show UTC days (62/193 against the MCP's UTC 64/195).
- The UI confirms 18m 16s on
/article: the wrong time on page is Pirsch's data.
- Matomo: identical (49 visits, 103 page views, 235 s, 14 → 1 → 1, 2, 1, 2, 4 orders for €32). The UI shows direct entry as a row; the MCP inferred it.
- Cloudflare: identical (95 visits, 196 page views, France 19,
/templates5). The UI got there in four clicks; the MCP needed hand-written GraphQL. - PostHog: the MCP's numbers match the tables, not the headline. 41
visitors and 106 page views through MCP, in the trends insight and in the
web analytics tables. The headline tiles of the same page say 39 and 76.
- Funnel 11 → 0 → 0, time on page 59.4 s, PDF 3, revenue 24: the same.
- Mixpanel: identical (40 users, 124 page views, France 5, the same
referring domains, PDF 3, w3.org 1,
b11 dead / 1 rage,/templates3, 5 purchases for 40). The saved board funnel says 13 → 2 → 2; the MCP's new funnel said 13 → 1 → 1. The UI took a report per question too, so it is no faster than the server. - LogRocket: the UI is exact where the MCP drifted.
- The session list with UTC days gives 97 sessions, France 18, LinkedIn 11,
funnel pages 25/4/4, PDF 3, outbound 5,
/templates5 and 7 purchases. - The Sonnet MCP run gave 47 users, 19 sessions from France and a 17-19 Nov funnel. It moved the period in five answers and found no PDF clicks.
- The Opus run got closer (25 → 4 → 4, PDF 3, outbound 5).
- Both found dead clicks on "Duplicate form" and no rage clicks.
- The session list with UTC days gives 97 sessions, France 18, LinkedIn 11,
funnel pages 25/4/4, PDF 3, outbound 5,
- Fathom, Amplitude, Mouseflow: no comparison. Fathom has no MCP server that answers analytics questions (the community one lists sites and current visitors). Amplitude's needs Enterprise or the Plus add-on, and Mouseflow's Premium; neither is our plan. Umami's needs Pro.
- Clarity: the UI can do exact UTC days (through the URL), which its MCP
server cannot (last 1-3 days only).
- Both agree on 112 sessions, no rage clicks and no element for the dead clicks in the dashboard view.
- Only the heatmap names elements.
- Sentry: the UI names the element ("Most Dead Clicks: button#b 3") as a
ready widget. The Sonnet MCP run had no per-element counts; the Opus run
found
button#bby going through replays. - GA4: the same window, later numbers.
- Round 1's MCP answers (19 Nov, 09:25 UTC) used the same Los Angeles days.
The counts that matched then still match: downloads 1, outbound clicks 2,
/templates3, purchases 3. - Users, page views and the funnel's first step are higher in the UI now: 28 vs 26 users, 105 vs 94 views, 13 vs 11 entering. The difference is the manual round. It happened 2 hours before the MCP run and wasn't processed yet. The UI now shows its 3 Thailand users.
- So a GA4 answer depends on when it is asked, a day after the period ends.
- The MCP assistant reported revenue as "24 EUR"; the UI shows $26.44.
- The Opus repeat rebuilt exact UTC days from GA4's hourly data
(
dateHour). In the standard reports a range is whole property days.
- Round 1's MCP answers (19 Nov, 09:25 UTC) used the same Los Angeles days.
The counts that matched then still match: downloads 1, outbound clicks 2,
- Timezones in the UIs:
- UTC directly: Privatrak, Plausible, Matomo, PostHog and Sentry show UTC days.
- Exact times allowed: Cloudflare's picker is in the browser's zone but takes times.
- Only through the URL: Clarity, in the browser's zone. LogRocket's dashboards too; its Session Replay list has a UTC switch.
- UTC directly (the third round's tools): Fathom and Amplitude show UTC. Mouseflow takes days in UTC. Umami's picker gives UTC days, but its URL holds the browser's midnights, so an edited URL is off by the browser's offset.
- Not at all: Pirsch (domain zone) and GA4 (property zone).
- Personal data on screen: LogRocket and Sentry show visitors' full IP addresses as labels in their session and replay lists. In the lab these are proxy and VPN exits, not people; on a real site they would be visitors' IPs. None are written here.
7.19 Questions not asked
- Mouseflow: Q6 and Q7, only in the click heatmap viewer, which loads the lab page and so wasn't opened. Q2: no source report found on the dashboard.
8. MCP answer test (19 Nov)
Two rounds on 19 Nov. Round 1 (morning, Claude Sonnet): ten fixed questions and one setup task per server. Round 2 (afternoon, Claude Opus, below the per-tool part): a free report without project IDs, the ten questions again, a fuller setup with clean-up, the size of each server in the assistant's context, and Clarity.
How the servers were connected, and what each vendor documents, is in chapter 6. This chapter is what happened when an assistant actually asked them. Every answer of round 1 is quoted in Appendix E, and every report of round 2 in Appendix F.
8.1 How it ran
- One assistant per server, the same brief. A headless Claude Code run
(
claude -p, model Sonnet) in an empty working folder, allowed to use only that one server's tools (no files, no web, no shell). 19 Nov, 09:25-09:40 UTC, all runs in parallel (Sentry again alone afterwards). The brief is reproduced below; the raw transcripts are not published. - Ten questions about 17-18 Nov (UTC), the list in section 3.9: visitors
and page views; top sources; visitors from France; average time on
/article; the contact funnel/pricing→/contact→/thanks; PDF downloads; outbound clicks to w3.org; the element on/labwith the most rage and dead clicks; visits to the 404 page; purchases and revenue. - Then: list every tool, split into read and write, and try one harmless
setup task where the server can write (the contact funnel, or a goal),
every object named
MCP test: …, nothing existing touched. Sentry and Cloudflare were told not to write (their writes are infrastructure). - Difficulty is the assistant's own score per question: 5 one obvious call, 4 a lookup first, 3 trial and error or interpretation, 2 a raw query language or several failed calls, 1 not possible.
- Expected numbers come from the visit records (
visits.jsonl, chapter 5): per tool, the visits whose requests to that tool were answered with a 2xx, so a tool that never got a visit is not blamed for it. "Visitors" has no single true value: 47 personas over both days, 72 person-days (what a daily-salt tool should count). For tools that need consent the expected numbers are an upper bound (a 2xx can be a config request without a recorded event).
The 10 runs that reached data made 161 calls to their servers and took 43 s (Plausible) to 6.6 minutes (Mixpanel) each.
The brief, as every round-1 session received it
Each session started from this text, with the server's name above it.
You are testing how well one analytics tool's MCP server answers questions. Use ONLY the tools of the MCP server named above (the tool names start with its prefix). Do not use any other tool, file, website or prior knowledge. Never guess a number: every number you give must come from a tool result. If the server cannot answer a question, say so and why. Do not call any feedback tool (such as send_feedback).
The site is clicklab.privatrak.com, a small test site ("Mapleform"). Its timezone is UTC in every tool.
Part 1: questions
Period: 17 and 18 November 2026 (both days together, UTC), unless a question says otherwise. If the server cannot select exactly that period, use the closest it allows and say which period you got.
- Visitors (unique visitors / users) and page views over the period, and per day if available.
- Top traffic sources: the top 5 with their visitor (or session) counts, and where direct traffic stands.
- Visitors from France.
- Average time on page (or engagement time) for the page /article.
- Contact funnel: how many visitors reached /pricing, then /contact, then /thanks (in that order). Use a funnel the project already has if there is one; otherwise compute it if the server allows.
- Downloads of the PDF /mapleform-checklist.pdf.
- Outbound clicks to w3.org (the link https://www.w3.org/WAI/tutorials/forms/).
- On the page /lab: which element got the most rage clicks, and which the most dead clicks (with counts).
- Visits to the 404 page (the path /templates does not exist and returns a 404 page).
- Purchases: how many "Purchase" events and how much revenue (EUR).
For each question record: the answer exactly as the tool reports it, what the number means in this tool (its own definition, e.g. "visitors" vs "sessions"), the tool calls you needed, and a difficulty score for an AI assistant:
- 5: one obvious call with a matching tool and plain parameters
- 4: right tool quickly, but needed a lookup first (e.g. list goals or event names)
- 3: trial and error, unclear tool or parameter names, or results that needed interpretation
- 2: had to build a query in a raw API or query language, or several failed calls
- 1: not possible with this server
Part 2: what the server can do
List all the tools the server offers, split into reading and writing (changing setup or data), in one line each.
Part 3: can it set something up?
[per server: the contact funnel, or a goal for /thanks; Sentry and Cloudflare were told not to write]
Rules for writing: create only new objects whose name starts with "MCP test:"; never change, rename or delete anything that exists; never touch settings, users, billing, keys, DNS, workers or anything outside analytics setup. If the server has no suitable write tool, say so and do not work around it.
Output
First a short plain-text summary (what worked, what did not, anything surprising about the data or the server). Then, as the last thing in your reply, one fenced ```json block exactly in this shape:
{"server": "...", "answers": [{"q": 1, "status": "answered|partial|needs_setup|not_possible|error", "answer": "...", "definition": "...", "calls": 0, "tools_used": ["..."], "difficulty": 5, "difficulty_why": "..."}], "capabilities": {"read_tools": ["..."], "write_tools": ["..."], "notes": "..."}, "setup_test": {"attempted": true, "what": "...", "result": "created|refused|not_supported|error|skipped", "id_or_url": "...", "notes": "..."}, "notes": "errors, limits, data delays, quirks"}
8.2 Results at a glance
✓ answered and close to the expected number · ≈ answered, but another metric, another period or a clear gap · ✗ answered and wrong · – the server cannot answer · E the server failed
| Tool (server) | Q1 visitors, views | Q2 sources | Q3 France | Q4 time on /article | Q5 funnel | Q6 PDF | Q7 outbound | Q8 rage/dead | Q9 404 | Q10 purchases | Can set up? |
|---|---|---|---|---|---|---|---|---|---|---|---|
| Privatrak (official) | ✓ | ✓ | – | ≈ | ✓ | ✓ | ≈ | ✓ | ✓ | ✓ | yes, funnel created, undoable |
| PostHog (official) | ✓ | ✓ | ✓ | ✓ | ≈ | ✓ | ≈ | ≈ | ✓ | ✓ | yes, funnel insight created |
| Mixpanel (official) | ✓ | ≈ | ✓ | – | ✓ | ✓ | ≈ | ✓ | ✓ | ✓ | yes, board with the funnel created |
| Plausible (community) | ✓ | ✓ | ✓ | ✓ | ≈ | ✓ | ✓ | – | ✓ | ≈ (revenue E) | no write tools |
| Pirsch (community) | ✓ | ✓ | ✓ | ✗ | ≈ (E) | ≈ | ✓ | – | ✓ | ✓ | no write tools |
| Matomo (official) | ≈ | ≈ | ✓ | ✗ | ≈ | ≈ | ≈ | – | ≈ | ≈ | yes, goal created (raw API) |
| GA4 (official) | ≈ | ≈ | ≈ | ≈ | ≈ | ≈ | ≈ | – | ≈ | ≈ | no (writes need a flag) |
| LogRocket (official) | ✓ | ✓ | ✓ | ≈ | ≈ | – | – | ≈ | ✓ | ≈ | no write tools |
| Cloudflare (generic API) | ≈ | ✓ | ✓ | – | ≈ | – | – | – | ≈ | – | could change anything (not tried) |
| Sentry (official) | – | – | – | – | – | – | – | ≈ | – | – | no analytics writes |
| Clarity (official, round 2) | ≈ | ≈ | ✗ | ≈ | ≈ | – | – | ≈ | ✓ | ≈ | only AI-visibility topics |
GA4's row is all ≈ for one reason: its property runs on Los Angeles time, so "17-18 Nov" was a different window (see GA4 below). Against that window its numbers are close.
| Tool | MCP calls | Failed calls | Answered / partial / not possible | Avg difficulty (answered) | Time |
|---|---|---|---|---|---|
| Privatrak | 18 | 0 | 8 / 1 / 1 | 4.1 | 57 s |
| PostHog | 25 | 1 | 9 / 1 / 0 | 3.4 | 136 s |
| Mixpanel | 24 | 0 (2 came back empty) | 5 / 4 / 1 | 3.0 | 399 s |
| Plausible | 15 | 3 | 7 / 2 / 1 | 4.0 | 43 s |
| Pirsch | 21 | 2 | 8 / 1 / 1 | 3.9 | 50 s |
| Matomo | 18 | 1 | 8 / 1 / 1 | 3.9 | 86 s |
| GA4 | 13 | 1 | 8 / 1 / 1 | 3.9 | 54 s |
| LogRocket | 15 | 0 | 3 / 6 / 1 | 3.4 | 107 s |
| Cloudflare | 5 | 1 | 2 / 2 / 6 | 2.2 | 77 s |
| Sentry | 7 | 0 | 0 / 1 / 9 | 2.0 | 73 s |
8.3 What the test shows across tools
- The server's shape decides more than the tool behind it. Four shapes:
- Typed analytics tools (Privatrak, Plausible, Pirsch, GA4's
run_report): one call per question, plain parameters, exact dates. Fastest and cheapest. - A raw query language behind one tool (PostHog's
execwith HogQL, Cloudflare'sexecutewith GraphQL, Matomo's raw API calls): everything is possible in principle, but the assistant writes queries, guesses field names and retries. PostHog answered all ten this way; Cloudflare's introspection failed and field names were guessed. - Natural-language tools (LogRocket's
build_metric, Clarity'squery-analytics-dashboard): no parameters to get wrong, but the tool rewrites the question. LogRocket moved the period to include 19 Nov in five of ten answers and answered two questions with a question back. - No analytics at all (Sentry: replays as lists, at most 100, relative
periods like
7donly).
- Typed analytics tools (Privatrak, Plausible, Pirsch, GA4's
- Exact periods are not a given. Exact dates: Privatrak, Plausible,
Pirsch (with
timezone=UTC), Matomo, PostHog, Cloudflare, Mixpanel. Not: GA4 (property timezone, no override), LogRocket (drifted), Sentry (relative only), Clarity (last 1-3 days only). - Two lab tools were not on UTC, against the setup rule "timezone UTC everywhere": the GA4 property is on America/Los_Angeles and the Pirsch domain on Asia/Bangkok. Pirsch's API takes a timezone per query, so the MCP answers were UTC anyway; GA4's cannot. This matters for the dashboard test (chapter 7) too: GA4's "17 Nov" is 17 Nov 08:00 UTC to 18 Nov 08:00 UTC.
- Event names had to be discovered in every tool with custom events (goal or event lists first, then the property that holds the URL). Where a server has no list tool (Plausible, LogRocket) the assistant breaks down by goal or guesses; LogRocket could not find the download at all.
- Revenue is the weakest answer. Correct in Privatrak, Pirsch, PostHog and Mixpanel (Pirsch and Mixpanel without a currency). Plausible's server fails with a schema error on any revenue metric; Matomo needs the ecommerce report, not the event; LogRocket asks which property holds it.
- Rage and dead clicks came through Privatrak (exact: "Duplicate form",
4 rage, 7 dead), PostHog (via SQL on
elements_chain; dead right, rage a tie at 1), Mixpanel (by element id:b, the "Duplicate form" button, 11 dead clicks, 1 rage click) and LogRocket (dead clicks found, 9, not limited to the period; no rage clicks found). Clarity, Mouseflow and Amplitude, which also detect them, were not reachable. - Setting things up works in four of the ten servers with data:
Privatrak (typed
create_funnel, inside a setup run that one call can undo), PostHog (typedinsight-create, among ~640 sub-commands that also include deleting persons and changing project settings), Mixpanel (no saved-report tool: the funnel went onto a new board withCreate-Dashboard) and Matomo (only through the rawGoals.addGoalAPI call; the dedicated goal tools only read). None but Privatrak can undo. GA4's three write tools exist only with--allow-writeand the edit scope, which Google's guide does not set up. Cloudflare'sexecutecould change any resource the token allows, with nothing between read and write. - Connecting is not the same as working. Sentry's server did not finish connecting in the parallel run (its tools never appeared; a second run alone worked), PostHog timed out once and worked on retry, and Clarity's server asked for a browser sign-in in the middle of the run.
8.4 Per tool
Expected numbers are for the tool's delivered visits, 17-18 Nov UTC.
Privatrak (official, hosted, OAuth)
- Can ask: traffic, sources, pages with time on page and scroll depth, features (downloads, outbound links as named features), funnels, click problems, insights queries, flows. No country (by design: no geodata).
- Ease: 18 calls, none failed. A
projectid on every call (the connection covers several projects). Answers came from typed tools; page views needed an insights query, revenue a sum over thetotaldetail. - Quality:
- Q1 72 visitors (person-days, per day summed) and 200 page views, against 72 and 200 expected (chapter 5).
- Q2 LinkedIn 11 (11), then Google, DuckDuckGo, Product Hunt; direct 6.
- Q4 61 s on
/article: active time (visible tab, input), against 77 s wall-clock time per view; a different measure, said in the answer. - Q5 the saved funnel: 24 → 4 → 4 (23 → 4 → 4; the new-tab link to
/pricingon/labadds one). - Q6 4 downloads (4), Q7 6 outbound clicks (7: one Firefox visit lost its
leave-time send, known from day 2), Q9 5 views of
/templates(5), Q10 7 purchases and 56 EUR (7, 56). - Q8 exact: "Duplicate form", 4 rage clicks and 7 dead clicks (4 and 7 visits).
- Downloads and outbound clicks are matched by link text, not URL: the server exposes no link target.
- Setup: created "MCP test: contact funnel" in setup run
a setup run, after
preview_funnel. Counts from 19 Nov (funnels count from creation).
PostHog (official, hosted, OAuth)
- Can ask: anything in HogQL (
execute-sql), plus typed web overview, trends, funnels, paths, retention, insights, dashboards, recordings. - Ease: one
execgateway in front of ~640 sub-commands; the server wantslearnandread-data-schemafirst. 25 calls, most of them SQL. The first funnel SQL failed on a DateTime64 type. First connect timed out. - Quality:
- Q1 41 persons, 106 page views, 53 sessions (38 personas, ≤ 126 page
views delivered); the typed
query-web-overviewgave the same numbers. - Q2 direct 17, LinkedIn 7, DuckDuckGo 6, Reddit 6: grouped by hand.
- Q3 6 visitors from France, Q4 59.4 s (from
$prev_pageview_durationon leave events), Q9 3not_foundevents, Q10 3 purchases, 24 EUR (3). - Q5 the saved funnel is a rolling 7-day insight, so it was recomputed in
SQL: 11 → 0 → 0. PostHog has no
/contactor/thankspage view at all on those days, although up to two contact visits were delivered to it (chapter 7 has the dashboard's answer). - Q6 3 PDF clicks (autocapture, no download event), Q7 2 outbound (≤ 4), Q8 dead clicks "Duplicate form" 6; rage clicks a three-way tie at 1.
- Q1 41 persons, 106 page views, 53 sessions (38 personas, ≤ 126 page
views delivered); the typed
- Setup: created insight "MCP test: contact funnel"; defaults of 14-day window and last 7 days. The same server can delete persons, change project settings and launch experiments.
Mixpanel (official, hosted, OAuth, EU URL)
- Can ask: insights, funnels, flows and retention through one
Run-Querytool that takes report JSON built fromGet-Query-Schema; events, properties, saved reports, boards, cohorts, flags, experiments. - Ease: 24 calls, none failed, but slow (6.6 minutes, the longest run):
every report is hand-built JSON, the first connect timed out, and the
rage/dead click queries came back empty until the assistant found that
those events carry
$pathname, notcurrent_url_path. - Quality: (39 personas, ≤ 138 page views delivered)
- Q1 40 users, 124 page views. Q3 France 5 users. Q10 5 purchases, 40 EUR (5, 40 EUR: right).
- Q2 no source or channel property: by referring domain, where the site itself is the biggest "source" (20 users) and direct shows as "undefined" (19).
- Q4 not possible: no time on page in Mixpanel's autocapture.
- Q5 the saved funnel did not match (no
/thanksstep, other period), so a new one: 13 → 1 → 1 (≤ 18 → 2 → 2). - Q6 3 PDF link clicks (3), Q7 1 w3.org click (≤ 3), Q9 3 views of
/templatestitled "Page not found" (≤ 4): autocapture clicks and page titles, no download, outbound or 404 events. - Q8 by element id only:
b("Duplicate form") 11 dead clicks and 1 rage click; no text or selector in the answer.
- Setup: no tool saves a report on its own, so the funnel went onto a new board "MCP test: contact funnel". The server can also edit and bulk-edit events and properties in the Lexicon.
Plausible (community server by Sentry, Stats API key)
- Can ask: timeseries, breakdowns by any dimension, goal conversions, period comparison. No funnels, no goal list, no writes.
- Ease: 15 calls, 3 failed (all revenue). Exact dates. Goal names found
by breaking down by
event:goal. - Quality: Plausible keeps only the non-Chromium visits (39 delivered,
26 person-days).
- Q1 31 visitors, 77 page views. Q3 France 2 (2 person-days). Q4 66 s (79 s). Q6 3 (3), Q7 4 (4), Q9 3 (3), Q10 3 purchases (3).
- Q5 per-page visitors only (8 / 1 / 1), no order: Plausible's funnels are not in the Stats API.
- Q10 revenue: every
total_revenuerequest fails with "Output validation error" (a server bug, or Plausible returns no revenue for the goal). - Time on page comes without a unit.
- The revenue error, verbatim: "Output validation error: Invalid structured content for tool compare_periods: period_a.metrics.total_revenue: Invalid input": the server's output schema rejects the revenue values Plausible returns.
Pirsch (community server, OAuth client)
- Can ask: one
pirsch_query_statisticstool with ~30 metrics (pages, referrers, countries, events, event metadata, conversion goals, funnels…). - Ease: 21 calls, 2 failed. The domain is on Asia/Bangkok; passing
timezone=UTCgave UTC days. - Quality:
- Q1 64 visitors, 195 page views (68 person-days, 194). Q3 France 12 (11).
- Q2 LinkedIn 10, Google 9, direct 8; "Google" and "google" are separate rows.
- Q4 1,096 s on
/article: wrong (77 s). The default page list shows 0 unlessincludeAverageTimeOnPageis set;time_on_pageignored the path. - Q5 the
funnelsmetric returned "not found" twice (it takes no funnel id); per-page 23 / 4 / 4 is right but unordered. - Q6 3 downloads (4), Q7 6 (6), Q9 5 (5), Q10 7 purchases, revenue 56 with no currency (7, 56 EUR).
Matomo Cloud (official, hosted, auth token)
- Can ask: every processed report (
matomo_report_processed), the raw API (matomo_api_call_*), goals, segments, dimensions. - Ease: 18 calls; reports had to be found in the report list first. Unique visitors over a range are switched off in Matomo ("nb_uniq_visitors is not enabled for the requested period"), so only per-day visitors.
- Quality: Matomo itself counts fewer visits than it was sent (49 of 78
delivered; 7 of 15 on 18 Nov), so every number is lower. Checked in the UI
in chapter 7.
- Q1 49 visits, 103 page views (the 117 in the summary are "actions").
- Q2 "Keyword not defined" (search) 13 first; direct is no row at all and had to be inferred as the remainder.
- Q3 France 10 visits, Q4 235 s on
/article(77 s; why it is three times longer was not resolved), Q5 the goal funnel 14 → 1 → 1 (its steps are not required in order), Q6 2, Q7 1, Q9 2, Q10 4 orders, 32 EUR.
- Setup: created goal "MCP test: thanks page" (URL contains
/thanks) through the rawGoals.addGoalcall.
Google Analytics 4 (official, local, own OAuth client)
- Can ask:
run_reportwith any GA4 dimensions and metrics, funnel and conversion reports, realtime, key events, custom dimensions. - Ease: 13 calls, 1 failed (funnels reject
pagePath, needpageLocation). Raw GA4 field names and enums throughout. - The property runs on America/Los_Angeles, and reports follow the
property's timezone: "17-18 Nov" was 17 Nov 08:00 to 19 Nov 08:00 UTC, which
drops day 1's main round (05:00-06:30 UTC) and adds day 3's. Against that
window:
- Q1 26 users, 94 page views (24 personas, 94 page views: exact).
- Q5 11 → 1 → 1 (14 → 1 → 1), Q6 1 download (2), Q7 2 (3), Q9 3 (3), Q10 3 purchases, 24 EUR (5).
- Q4 no time-on-page metric: 618 s engagement over 11 views, divided by the assistant (56 s per view).
- Setup: no write tool; the three documented ones need
--allow-writeand the edit scope.
LogRocket (official, hosted, OAuth; free plan allowed it)
- Can ask: natural-language metrics (
build_metric), sessions, issues (errors, rage and dead clicks), network logs, AI session analysis. - Ease: 15 calls, none failed, but the tool interprets the request: the period drifted into 19 Nov in five answers, and it answered two questions (outbound clicks, revenue) with a question back. Responses are large (session lists).
- Quality: Q1 47 users, 199 page views (44 personas, 192). Q2 LinkedIn 11 (11), direct 27. Q3 19 sessions (18). Q4 34 s. Q5 34 → 5 → 5 sessions over 17-19 Nov (27 → 5 → 5). Q6 nothing found. Q8 dead clicks "Duplicate form" 9 (counted since 14 Nov), rage clicks none. Q9 5 (5). Q10 7 sessions with a purchase (7), no revenue.
- Setup: no write tool.
Cloudflare Web Analytics (generic Cloudflare API server, OAuth)
- Can ask: anything the Cloudflare API has, through JavaScript that the
assistant writes (
execute): REST to find the account and site, GraphQL (rumPageloadEventsAdaptiveGroups) for the data. - Ease: 5 calls, but long ones: finding the site tag, writing GraphQL, introspection returned null, field names guessed.
- Quality: Q1 95 visits (95 delivered: exact), 196 page views (190); no
unique visitors exist. Q2 direct 36, Google 9, LinkedIn 9. Q3 France 19
visits (18). Q9 5 views of
/templates. Nothing else exists in the product (no events, time on page or funnels). - Setup: not tried. The same
executecould create or delete any resource the token allows (DNS, Workers, sites); no read-only mode.
Sentry (official, hosted, OAuth)
- First run: the server never finished connecting while ten sessions started at once; the second run alone worked.
- Can ask: errors, issues, traces, replays (as lists of at most 100),
logs, profiles. Periods only relative (
7d). - Quality: no traffic numbers at all (tracing off, replays sampled and not
countable). Q8: replays on
/labwith dead clicks exist, rage clicks none in 7 days; no per-element counts. - Setup: writes exist for issues, alerts, monitors, projects and teams, none for analytics.
Microsoft Clarity (official, local npx)
- Round 1 stopped at "Not signed in": the server's
logintool opens a sign-in page in the default browser, which nobody completed in a headless run, and no Data Export token is configured. - Signed in later the same day by starting the server alone, calling
loginand opening its link in a browser signed in to Clarity: approved at once, no consent screen, and the sign-in is remembered for later runs. The server also opened the same link in a second browser, where the sign-in then hit a closed local callback: harmless, but two windows for one sign-in. - Asked in round 2: see there.
Not testable on our plans, or skipped
Umami (MCP from Pro), Amplitude (Enterprise or the Plus add-on), Mouseflow (Premium), Fathom (the community server has 3 tools: account, sites, current visitors; it cannot answer any of the questions). Simple Analytics is not in the lab.
8.5 Round 2 (19 Nov, afternoon)
Same folder and servers, model Opus, four sessions at a time (with a
WaitForMcpServers step, which fixed round 1's connection failures). 26
sessions: a report and the ten questions on all 11 servers, the setup test on
the four that can write. The transcripts are not published.
A report, as a site owner would ask for it
The brief named only the site, not the project: "write me a short analytics report on 17 and 18 Nov: traffic, sources, what people did, problems, what stands out, three recommendations", every number from a tool result, saved if the server can store reports. Every number the report states was listed and searched for in the session's tool results.
| Tool | Found the project | Calls, time | Numbers stated, found in tool results | Broken /templates link | Dead "Duplicate form" | "Save draft" error | Saw test traffic | Saved |
|---|---|---|---|---|---|---|---|---|
| Privatrak | 3 calls (the server lists its projects) | 25, 2.9 min | 70, all | – (no 404 data) | ✓ | ✓ | ✓ (automated share, the burst) | review, undoable |
| PostHog | 4 | 36, 3.5 min | 72, 69 (3 rounded) | ✓ incl. the link on /product | ✓ | ✓ | burst | notebook |
| Mixpanel | 8 | 27, 4.4 min | 61, all | ✓ incl. the link | ✓ (as #b) | – | ✓ | board with text and 4 charts |
| Matomo | 3 | 28, 1.9 min | 72, all | ✓ | – | ✓ | – | nowhere to save |
| GA4 | 2, then rebuilt UTC days from hourly data | 18, 2.7 min | 46, 41 (rates) | ✓ incl. the link | – | – | ✓ | nowhere to save |
| Plausible | 1 (no site list: used the domain given) | 25, 2.4 min | 73, 72 | ✓ | – | – | – | nowhere |
| Pirsch | 1 | 23, 1.3 min | 45, 37 (rates) | ✓ | – | – | burst | nowhere |
| LogRocket | 3 | 12, 2.9 min | 66, all | ✓ | ✓ | ✓ | ✓ (the Singapore IP: the VPN round) | nowhere |
| Cloudflare | 3 | 8, 1.6 min | 48, 41 (unit conversions) | – | – | – | ✓ | nowhere |
| Sentry | 3 | 23, 4.8 min | 37, all | ✓ (replays) | ✓ (button#b) | ✓ | ✓ (read the #r= labels) | nowhere |
| Clarity | 1 | 10, 2.0 min | 52, 45 | ✓ | – | ✓ | – | nowhere |
- No invented numbers. Every number not found verbatim was a rate, a sum or a unit conversion of numbers that were. The difference between reports is what the server gives them, not honesty.
- Most complete: PostHog's report found all three site defects and its
own measurement gaps (no
/contact,/thanksor/apppage views; a failing Amplitude snippet). LogRocket's and Sentry's also found all three defects and saw the test traffic, with every number found in their tool results. Privatrak's named the two broken controls with every number found, but could not see the 404 (Privatrak records no page status); the TypeError it reported after "Place order" is likely its own false positive (chapter 14). Mixpanel's noticed that every 18 Nov visitor had also come on 17 Nov (right: day 2 was returns). - Wrong conclusions came from what the tool records, not from the model: Plausible read the smaller day 2 as "engagement collapsed" and recommends looking for a bad deploy; LogRocket calls the PDF link broken (a same-tab download looks like a dead click); Clarity calls "Open pricing in a new tab" broken for the same reason; Cloudflare and Clarity recommend speeding up pages measured at 12-14 s through the residential proxies.
- Saving: Privatrak (an AI review, in a setup run that can be undone), PostHog (a notebook) and Mixpanel (a board with a text card and charts). The other eight have nowhere to keep a report.
The ten questions again (Opus instead of Sonnet)
- Same numbers from Privatrak, Plausible, Pirsch (including the wrong 1,096 s, so that is the server's data), Matomo and Cloudflare. PostHog the same except time on page (59 s → 83 s, computed another way).
- Different, and better:
- GA4: the assistant rebuilt exact UTC days from the property's hourly data
(
dateHour): 49 users and 179 page views (43 personas, 186 page views expected). Downloads 2, outbound 3, 404 5 (5), purchases 5 for 40 EUR. - LogRocket: kept the period, funnel 25 → 4 → 4 (22 → 4 → 4), found 3 PDF clicks and 5 outbound clicks by link text.
- Sentry: counted replays by hand: France 13,
/templates3, dead clicks onbutton#b. - Mixpanel used the first-touch referrer, so its top source changed.
- GA4: the assistant rebuilt exact UTC days from the property's hourly data
(
- So the servers that answered from fixed reports or queries (typed or raw) gave the same numbers with both models; the natural-language and list-based servers (LogRocket, Sentry) and the ones where the assistant chose a metric (Mixpanel, GA4) changed.
- Clarity, first answers (its window: 17-19 Nov; 90 delivered visits plus
4 manual ones, about 205 page views): 159 page views, no totals row; top
"source" its own domain (58 sessions); France 29 sessions (at most 17 French
visits were sent: off);
/article37 s active time;/pricing25 →/contact1 →/thanks1 sessions (26 → 5 → 5), page level only;/templates4 (5);/lab5 dead clicks and no rage clicks, no element; no downloads found; 4 purchase sessions on 17-18 Nov (7), no revenue. 18 calls over both runs, 8 of them dashboard queries, inside the 10 a day.
Setting up, then cleaning up
The task: a goal for /thanks, a dashboard with visitors per day and the
contact funnel, read both back, then remove everything (undo if there is one).
| Tool | Goal | Dashboard, 2 charts | Read back | Clean-up |
|---|---|---|---|---|
| Privatrak | ✓ (a funnel marked as goal; needs 2 steps, so step 1 "any page view") | partial: charts count events, not visitors (page views per day instead); no funnel chart (three numbers) | ✓; a chart stores no period, so that could not be checked | undo: dry run listed 4 objects, the undo removed all 4; only the run's history entry stays |
| PostHog | ✓ as an action (PostHog has no goals) | ✓ unique users per day and a real funnel | ✓ (one read tool returned null for the funnel, another worked) | deleted one by one, no undo or dry run; soft-deleted, still stored |
| Mixpanel | ✗ no goal object; a cohort was refused ("plan does not allow saving cohorts") | ✓ board with both reports | partial: saved query definitions cannot be read back | board deleted, its reports with it |
| Matomo | ✓ plus a goal funnel | ✗ the API creates an empty dashboard and cannot add widgets | ✓ | deleted one by one, no undo |
How much of the assistant's context each server takes
Tool definitions loaded up front (Claude Code with tool search switched off; by default it loads tools only when needed, other clients may load all), measured as the context of the first turn minus a run without the server. Rough: about ±3,000 tokens of noise.
| Server | Tools | Context |
|---|---|---|
| Mixpanel | ~60 | ~64,000 tokens |
| Privatrak | 53 | ~60,000 |
| Sentry | 74 | ~55,000 |
| Clarity | 30 | ~33,000 |
| PostHog | 1 gateway + a few | ~15,000 |
| GA4 | 10 | ~12,000 |
| LogRocket | 9 | ~11,000 |
| Matomo | ~15 | ~9,000 |
| Plausible | 5 | ~8,000 |
| Cloudflare | 4 | ~5,000 |
| Pirsch | 3 | ~2,000 |
Answers per call (average characters, round 2): Plausible ~400, Pirsch ~1,000, Clarity ~2,000, Privatrak, GA4 and Mixpanel 3,000-4,000, Matomo and PostHog 5,000-6,500 (single answers up to ~49,000), LogRocket 15,000-26,000 on average: ten times most others, because it returns session lists.
Seen along the way
- The run label is visible to replay tools: Sentry's replays show landing
URLs like
#r=r4-d1-p06-contact, recorded before the probe removes the hash. Counting tools never see it. A#st-picker=…session on 18 Nov is Privatrak's Element Picker, opened by us (chapter 4). - A TypeError after "Place order" on
/checkout(Privatrak) and a failing Mouseflow script there (Matomo, Sentry): see chapter 14.
What is still not covered
- One run per model and task.
- Answers against each tool's own dashboard: chapter 7.
- Only Claude Code; claude.ai, the desktop app, Cursor and Codex sign in differently.
- Report quality judged by us only.
- Umami, Amplitude and Mouseflow: not on our plans.
9. Findings by topic
This chapter puts each question side by side across all tools, using both the dashboard answers (chapter 7) and the MCP answers (chapter 8). Expected numbers are always the tool's own delivered visits (chapter 5.2), plus "up to" the three page loads that are not in the records (2 visitors, 7 page views; chapter 5) where they matter. Where an explanation is our reading rather than something the records prove, it is marked as a hypothesis.
9.1 Visitors: one word, five units
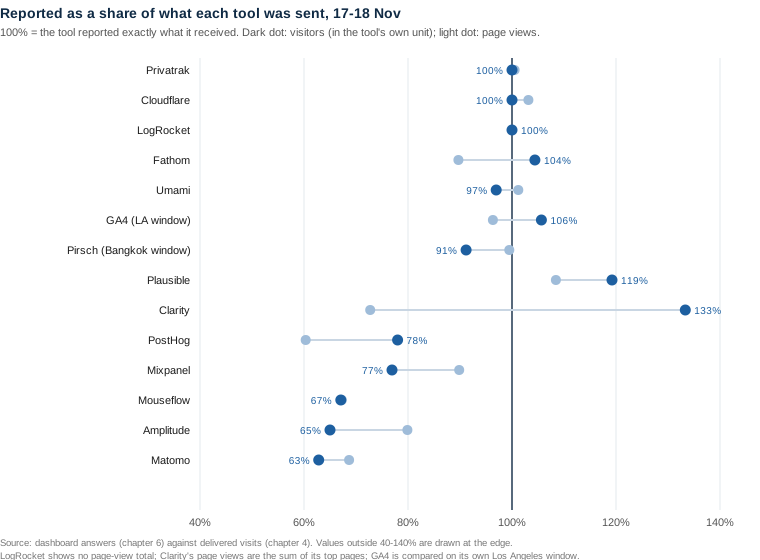
| Tool | Dashboard answer | Expected | Unit the tool counts | MCP answer |
|---|---|---|---|---|
| Privatrak | 72 visitors | 72: 71 person-days + the unknown visitor (checked, chapter 5) | visitor-day (daily-key hash of IP and UA) | 72 |
| Cloudflare | 95 visits | 95 visits + up to 2 | visit (no visitor concept) | 95 |
| LogRocket | 97 sessions | 97 visits + up to 2 | session | 47 users (Sonnet), a 17-19 Nov period |
| Fathom | 71 visitors | 68 person-days + up to 2 | visitor-day (daily-salt hash) | no usable server |
| Umami | 64 visitors, 71 visits | 66 person-days, 83 visits, + up to 2 | visitor (monthly salt by default) | not on our plan |
| Pirsch | 62 visitors (Bangkok days) | 68 person-days (UTC) + up to 2 | visitor-day | 64 (UTC, via timezone=UTC) |
| Plausible | 31 visitors | 26 person-days + up to 2 | visitor-day | 31 |
| GA4 | 28 active users (30 "total users" in Events) | ~26-27 in its Los Angeles window | user (cookie) | 26 (round 1); 49 for rebuilt UTC days (round 2; 43 personas expected) |
| Clarity | 112 sessions, 108 unique users | 84 visits | session; "46 bot sessions excluded" | 112 |
| PostHog | 39 visitors (headline); 41 in the tables below | 50 person-days, 38 personas | person (cookie) | 41 |
| Mixpanel | 40 users | 52 person-days, 39 personas | user (cookie) | 40 |
| Mouseflow | 40 visitors, 55 sessions | 82 visits, 58 person-days | recorded sessions only | not on our plan |
| Amplitude | 39 visitors, 54 sessions | ≤ 60 person-days (consent) | user (device ID) | not on our plan |
| Matomo | 49 visits (unique visitors not offered for a range) | 78 visits | visit | 49 |
| Sentry | – | 77 visits | sampled replays | – |
What the numbers show:
-
Daily-hash tools land close to person-days. These are Privatrak, Fathom, Umami, Pirsch and Plausible. Of their small overshoots (Fathom +3, Plausible +5), up to 2 are the visitors not in the records (chapter 5). The rest is most likely visits that changed IP or user agent partway through:
r4-d2-p19-latechanged IP within the visit.r4-d1-p35-outboundsent its leave with another user agent.- Proxy exits changed between a visit's pages.
This is a hypothesis: it was not traced visitor by visitor.
-
Cookie tools count persons, so they come out below person-days. PostHog, Mixpanel and Amplitude count a persona that returns the next day once, and they lost the consent decliners as well. PostHog's 41 persons and Mixpanel's 40 users sit right at the delivered personas (38-39), which is what they should count.
-
Session and visit counters land on visits. Cloudflare and LogRocket are exact. Clarity is the exception: it reports more sessions (112) than visits it was sent (84). Its sessioning splits visits, and its bot filter still excluded 46.
-
Two numbers on one screen.
- PostHog's web analytics headline says 39 visitors and 76 page views, while the tables below it and a trends insight say 41 and 106. A person reads the headline first.
- GA4 shows 28 "active users" in Pages and screens, and 30 "total users" in Events.
-
Matomo counted 49 of the 78 visits it was sent, and 7 of 15 on 18 Nov. It is explained by its 30-minute visit merge and by visits from most of the NordVPN exits never appearing; the setting behind those drops is not identified (chapter 10). It also dropped the pilot's NordVPN Singapore visits.
-
Mouseflow counts only what it records. That is 55 of 82 visits on the free plan.
9.2 Page views
| Tool | Dashboard | Expected | Notes |
|---|---|---|---|
| Privatrak | 200 (sum of the Pages list; Insights counts the same) | 200: 199 − 1 lost at a visit's end + 2 not in the records (checked event by event, chapter 5) | the total is an Insights query, not on the Overview; MCP asked Insights and got 200; 175 excluding automated visits |
| Cloudflare | 196 | 190 + up to 7 | |
| Umami | 166 | 164 + up to 7 | |
| Pirsch | 193 (Bangkok days) | 194 + up to 7 | MCP (UTC) 195 |
| Plausible | 77 | 71 + up to 7 | |
| GA4 | 105 | ~109 (window) + up to 6 | MCP round 1: 94 (same window, before the manual round was processed) |
| Fathom | 174 | 194 + up to 7 | 20 short, unexplained |
| Amplitude | 131 | ≤ 164 + up to 7 | |
| Mixpanel | 124 | ≤ 138 + up to 7 | |
| PostHog | 76 headline / 106 tables | ≤ 126 + up to 7 | |
| Mouseflow | 111 | 165 + up to 7 | recorded sessions only |
| Matomo | 103 ("actions" 117) | 150 + up to 7 | |
| Clarity | no total; top pages add up to ~128 | 176 + up to 7 | pages per session 1.14 |
| LogRocket | no total | 192 + up to 7 | MCP: 199 page views |
| Sentry | – | 146 + up to 7 |
No tool shows more page views than this allows. "Up to 7" is the most a tool can have received of the unrecorded page loads; only Privatrak's stored events could be checked one by one.
Query strings. Matomo keeps them by default, so /article?ref=producthunt is a row of its own. Most other tools strip or ignore them.
9.3 Sources and direct traffic
Delivered for all tools: direct 26 visits, LinkedIn 11, then DuckDuckGo, Hacker News, Google and Reddit 8 each.
| Tool | Top sources as shown (dashboard) | Where "direct" stands |
|---|---|---|
| Privatrak | LinkedIn 11, Google 8, DuckDuckGo 7, Product Hunt 7 | "Direct or unknown" 6 |
| Plausible | Direct 5, Google 5, LinkedIn 4, DuckDuckGo 3, Perplexity 3 | 5 (default tab: Channels) |
| Pirsch | LinkedIn 10, Google 9, DuckDuckGo 7, Hacker News 7, Reddit 7, producthunt 7 | Direct / None 6 |
| Umami | linkedin.com 10, chatgpt.com 7, reddit.com 7, news.ycombinator.com 7, google.com 6, duckduckgo.com 6 (exact) | only in Channels: Direct 20 |
| Fathom | LinkedIn 11, Google 8, DuckDuckGo 7, news.ycombinator.com 5 | Direct / Unknown 19 |
| Cloudflare | google 9, linkedin 9, reddit 8, duckduckgo 8 | None (direct) 36 |
| Matomo | Social 17, Search 13, Direct 7, AI Assistants 6, Campaigns 6; "Keyword not defined" 13 | a row in the UI; inferred as a remainder through MCP |
| GA4 | google 7, linkedin.com 7, reddit.com 4, bing 3 (default: channel groups) | (direct) 6 |
| PostHog | linkedin.com 7, duckduckgo.com 6, google.com 5, perplexity.ai 4 | $direct 14 (MCP grouped by hand: 17) |
| Mixpanel | clicklab.privatrak.com 20, google.com 8, reddit.com 7, linkedin.com 6 | "(not set)" 19 |
| Clarity | clicklab.privatrak.com 43, www.reddit.com 11, www.linkedin.com 10, chatgpt.com 9 | not a row |
| Amplitude | channels: Organic Search 13, Organic Social 13, Direct 9; by domain (a chart to build): LinkedIn 7, Google 7, Reddit 6 | (none) 8 |
| LogRocket | one source at a time: "Referrer URL contains linkedin" 11 (exact) | no list to rank |
| Mouseflow | no source report found | – |
What stands out:
- "Direct" means different things.
- Privatrak gives a visitor the source of their first page view of the day. Most lab visits came with a referrer, and the "direct" personas returned on other days with one, so it reports 6.
- Visit-based tools report 20-36.
- Plausible reports 5, of its own 12 delivered direct visits.
- The site itself as the top "source". Mixpanel (by referring domain) and Clarity (by referrer) list
clicklab.privatrak.comfirst, because internal navigation counts as a referrer there. Direct traffic is "(not set)" or missing. - Case. Pirsch's MCP answer has "Google" and "google" as separate rows. The newsletter's
utm_source=Newsletterwas sent with a capital on purpose. ref=producthunt(no referrer, arefparameter) is recognised as a source by Privatrak ("Product Hunt" 7), Pirsch ("producthunt" 7) and Matomo (Campaigns 6). In tools that only read the referrer it falls under direct.- AI assistants as a channel. Matomo has an "AI Assistants" channel (6), and Umami has "LLM" (8). ChatGPT visits carried
utm_source=chatgpt.comand a referrer. Perplexity visits carried only a referrer. - Default views hide the source. GA4, Plausible and Amplitude open on channel groups. The source is one switch away in GA4 and Plausible, and in Amplitude it is a chart to build.
9.4 Time on page: 0 seconds to 18 minutes for the same page
The true mean wall-clock time per view of /article was 77 s (25 views over all tools). Each tool's delivered views have means between 72.8 and 79.1 s.
| Tool | Dashboard | What the number is | Verdict |
|---|---|---|---|
| Plausible | 1 min 06 s (79 s wall-clock expected) | time on page, in the expanded Top pages | ✓ |
| PostHog | 59.4 s | average of $prev_pageview_duration on $pageleave, only through a trends insight | ✓ (MCP Opus computed 83 s another way) |
| Privatrak | 1 min 1 s | active time: tab visible, input within ~30 s; only the docs say so | ≈ (a different measure) |
| GA4 | 1 min 07 s | "Average online active user engagement time": per active user, not per view (11 users, 16 views) | ≈ |
| Mouseflow | visit time 47.3 s, engagement 43.1 s | from recorded sessions | ≈ |
| Clarity | "Active time spent 19 sec" | all sessions, not per page; MCP 37 s for 17-19 Nov | ≈ |
| Matomo | 3 min 55 s (235 s) | time on page | ✗ |
| Pirsch | 18 min 16 s (MCP 1,096 s) | time on page; MCP's default page list shows 0 unless includeAverageTimeOnPage is set | ✗ |
| Amplitude | 18 min 45 s | "Time Spent Per Page" | ✗ |
| Umami | 0 s | "Visit duration" for visits with /article; measured between page views, and 15 of 16 such visits saw only /article (bounce 94%) | ✗ |
| Mixpanel, LogRocket, Fathom, Cloudflare, Sentry | – | no per-page time (LogRocket: only as a filter condition; Fathom: only "avg time on site 00:59") | – |
Three tools show the same pattern of inflation on other pages too:
| Page | Pirsch | Amplitude | Matomo |
|---|---|---|---|
/thanks | 16 min 20 s | – | 17 min 33 s |
/search | 15 min 0 s | 15 min 3 s | – |
/templates | – | 8 min 37 s | 8 min 38 s |
Hypothesis, not verified. These tools likely measure the time from a page view to the visitor's next event. For some visits, the next event came much later:
- the return-within-the-hour visits, about 30 minutes after the first
- the next pages of a long-running persona
The end of a visit is not seen as the end of the page. Section 14.2 (item 3) tested this against each persona's next page view.
In short: time on page is the metric where the choice of tool changes the answer most, by a factor of more than 14 among tools that claim to measure the same thing.
9.5 Geography: visitors from France
| Tool | Dashboard | Expected (visits / person-days) | Verdict |
|---|---|---|---|
| Pirsch | 11 | 18 / 11 | ✓ |
| Plausible | 2 | 3 / 2 | ✓ |
| Umami | 12 visitors | 15 / 11 | ✓ |
| Cloudflare | 19 visits | 18 / 11 | ✓ |
| LogRocket | 18 sessions | 18 visits | ✓ exact |
| Matomo | 10 visits | 13 / 9 | ✓ |
| PostHog | 6 | 10 / 7 | ✓ |
| Mixpanel | 5 | 9 / 7 | ✓ |
| Amplitude | 8 (5 + 3 unique users per day) | ≤ 16 / 10 | ≈ |
| Fathom | 15 | 19 / 12; lists Brazil 20 first, though no persona was in Brazil | ≈ |
| Mouseflow | 5 (read off a bar chart without numbers) | 15 / 9 | ≈ |
| GA4 | 4 active users (Los Angeles window) | window differs | ≈ |
| Clarity | 25 sessions | 14 visits | ✗ (MCP: 29 for 17-19 Nov) |
| Sentry | – (MCP Opus counted replays by hand: 13) | 13 visits | – |
| Privatrak | – | – by design: no geodata stored |
Brazil in Fathom. In the pilot, Fathom placed NordVPN Singapore exits in Brazil. Later reads showed it places NordVPN's PacketHub exits and some residential exits there too (chapters 10 and 14), so Brazil 20 is VPN, data-centre and residential visits placed by Fathom's IP database.
9.6 The contact funnel
Expected funnel per tool: 23 → 4 → 4 for Privatrak and 22 → 4 → 4 for most others. Consent-gated tools expect less.
| Tool | Dashboard | Expected | MCP | Notes |
|---|---|---|---|---|
| Privatrak | 24 → 4 → 4 | 23 → 4 → 4 | 24 → 4 → 4 | the new-tab link on /lab adds one entry; the funnel list shows each funnel's own 31-day window without a label |
| Umami | 22 → 3 → 3 | 20 → 3 → 3 | – | Checkout funnel beside it: 22 → 7 → 7 → 7 |
| Pirsch | 23 → 4 → 4 | 22 → 4 → 4 | "not found" twice; per page 23 / 4 / 4 | works in the UI, fails in the server |
| Plausible | 8 → 1 → 1 ("3-step funnel, sequential") | 5 → 1 → 1 | per page only (8 / 1 / 1) | funnels are not in the Stats API |
| LogRocket | per page: 25 / 4 / 4 | 22 → 4 → 4 | Sonnet 34 → 5 → 5 (17-19 Nov); Opus 25 → 4 → 4 | an ordered funnel needs a chart |
| Mixpanel | 13 → 2 → 2 (saved board) | ≤ 18 → 2 → 2 | 13 → 1 → 1 (new funnel) | changing a board's date enters edit mode |
| Matomo | 14 → 1 → 1 | 19 → 3 → 3 | 14 → 1 → 1 | goal funnel steps not required in order |
| GA4 | 13 → 1 → 1 (window) | 14 → 1 → 1 (window) | 11 → 1 → 1 | built as an exploration: about 30 clicks; steps can't be typed as paths |
| PostHog | 11 → 0 → 0 | ≤ 13 → 2 → 2 | 11 → 0 → 0 | PostHog has no /contact or /thanks page view on those days |
| Amplitude | 15 → 1 → 0 | ≤ 20 → 4 → 4 | – | |
| Clarity | 15 → 0 → 0 | 22 → 4 → 4 | 25 → 1 → 1 (17-19 Nov) | |
| Mouseflow | 0 (0%) | 16 → 3 → 3 | – | no /contact or /thanks among recorded pages |
| Fathom, Cloudflare, Sentry | – | – | no funnels |
An open question. PostHog, Clarity, Mouseflow and Amplitude are missing most of the /contact → /thanks steps, although contact visits were delivered to them. Possible causes:
- The contact personas declined consent, so a tool received only configuration requests (the expected numbers are upper bounds).
- The form's submit navigation loses the next page view in these tools.
Section 14.2 (item 2) checked this: of the four visits that reached /thanks, three declined consent and one was a marked visit.
9.7 Rage clicks and dead clicks
The "Duplicate form" button does nothing. It got dead clicks in 7 visits and rage clicks in 4.
| Tool | What it shows | Element named by | Verdict |
|---|---|---|---|
| Privatrak | "Duplicate form": 7 no effect, 4 repeated clicks, on the Overview | its text, with the page | ✓ exact (UI and MCP) |
| Mixpanel | Dead Click by element ID: b 11, a 4, (not set) 17; Rage Click: b 1 | id only; no text or selector property | ✓ (dead), rage low |
| PostHog | UI: "Frustrating pages" /lab 3 rage, 11 dead (page level only; elements need the toolbar on the site); MCP via SQL on elements_chain: dead "Duplicate form" 6, rage a three-way tie at 1 | page; through SQL, text | ≈ |
| Sentry | "Most Dead Clicks: button#b 3, a 1"; "Most Rage Clicks: no results" | CSS selector | ≈ (sampled replays) |
| LogRocket | Dead Clicked "Duplicate form": 7 sessions (MCP 9, since 14 Nov); Rage Clicked: "No sessions found"; the Home widget "Most Rage Clicked Elements" says "No data found" | text | ≈ (dead exact, rage missed) |
| Amplitude | Dead Click by Element Text: Duplicate form 5, Delete form 2, Save draft 2, Publish form 1; no rage event | text | ≈ |
| Clarity | Heatmap /lab "Dead clicks": the paragraph text 3, the chart 1, "Open pricing in a new tab" 1; "Rage clicks" none; "Duplicate form" (11 clicks) not flagged | position in the heatmap | ≈ |
| Mouseflow | "Average click Rage events 0"; dead clicks on 2 page views; /lab friction score 0.5 | – | ≈ |
| Plausible, Pirsch, Matomo, GA4, Fathom, Umami, Cloudflare | – | – (Matomo has heatmaps but no rage or dead clicks per element; Umami's heatmaps need Business) |
What this shows:
- Dead clicks are defined differently.
- Amplitude counts clicks on the disabled "Delete form", the error-throwing "Save draft" and the slow "Publish form" as dead. Each is defensible.
- Clarity counts clicks on non-controls (text, chart) and on the new-tab link, but not on a real button that does nothing.
- Rage-click thresholds are high. Four visits clicked "Duplicate form" three or four times in quick succession (200-300 ms apart; patterns fixed before any tool was read, section 3.12). Only Privatrak counted all four. Mixpanel and PostHog counted one, and the replay tools counted none.
- Wrong conclusions. In the MCP reports, LogRocket called the PDF link broken: a same-tab download looks like a dead click. Clarity called "Open pricing in a new tab" broken, because a new tab looks dead to the page it was clicked on.
9.8 Downloads and outbound clicks
Expected: PDF 3-4 and outbound 4-7, per tool.
| Tool | Outbound to w3.org | How | |
|---|---|---|---|
| Privatrak | 4 (4) | 6 (7) | features named by feature rules (Privatrak's rules that give clicks a name) set up before the series, matched by link text; without setup the clicks are in Events, unnamed |
| Plausible | 3 (3) | 4 (4) | on by default, goals created automatically |
| Pirsch | 3 (4) | 6 (6) | arrive on their own (File Download, Outbound Link Click) |
| Matomo | 2 (3) | 1 (4) | automatic; in Visits Overview and as goals |
| GA4 | 1 (window: 2) | 2 (window: 3) | enhanced measurement; link_url is one drill-down further |
| PostHog | 3 | 2 (≤ 4) | autocapture; PDF only through a trends insight; outbound table in the page report |
| Mixpanel | 3 (3) | 1 (≤ 3) | [Auto] Element Click by "Link target" (the href), a name you have to know |
| Amplitude | 3 (3) | 2 (≤ 3) | Element Clicked by element text |
| LogRocket | 3 (3) | 5 (5) | filter "Clicked" by link text; the Sonnet MCP run found no PDF clicks |
| Clarity | – | 3 sessions (4) | smart event "Outbound click"; no download event |
| Fathom, Umami | – | – | only events the site sends |
| Cloudflare, Sentry | – | – | |
| Mouseflow | not answered | not answered | only the click heatmap would show them, and its viewer loads the lab page |
9.9 404 pages
/templates does not exist and returns a 404 page. It got 5 views (4 for some tools).
| Tool | Answer | How a person finds it |
|---|---|---|
| Plausible | 404 goal 3 (3) | automatic 404 goal: findability 5 |
| Pirsch | "404 Page Not Found" 5 (5) | event, automatic: 5 |
| Fathom | "404: /templates" 5 (5) | the lab sends Fathom a 404 event: 5 |
| PostHog | 3 not_found events, 3 views | 3 |
| Mixpanel | 3 views of /templates titled "Page not found" | 3 |
| Privatrak | 5 views | Pages: nothing marks it as a 404; you have to know the path (4) |
| Umami | 4 (exact) | filter by path: 4 |
| Matomo | 2 (4) | 4 |
| GA4 | 3 (3) | page title "Page not found" helps: 4 |
| Cloudflare | 5 (5) | paths list switched from 5 to 15 items: 3 |
| Clarity | 4 (5) | Top pages: 4 |
| Amplitude | 3 page views (5) | 4 |
| Mouseflow | 3 views (5); friction list counts "404" on 6 page views | 4 |
| LogRocket | 5 (5) | filter Visited URL: 3 |
Privatrak and the MCP reports. Privatrak's MCP report could not see the broken link at all, because Privatrak stores no page status. Most other servers found it (chapter 8.5).
9.10 Revenue
The lab sent 8 EUR per Team purchase: 7 purchases, 56 EUR in total. Each tool expects its own delivered purchases.
| Tool | Dashboard | Expected | MCP | Catch |
|---|---|---|---|---|
| Plausible | Purchase 3, revenue €24.0, avg €8.0 | 3, €24 | count 3; revenue error on every call | none in the UI; the community server's schema rejects revenue |
| Fathom | Purchase 7, €56 | 7, €56 | – | none |
| Umami | 7 orders, €56.00, with revenue per referrer and country | 7, €56 | – | the Revenue page opens in USD and shows "$0.00, 0 orders" |
| Mixpanel | 5 purchases, sum of amount 40 | 5, €40 | 5, 40 EUR | no currency shown; Aggregate Property → Sum |
| Amplitude | 5, revenue 40 | 5, €40 | – | the property first defaulted to $currency, giving 0 |
| Privatrak | Purchase 7; revenue 56 only through Insights (Sum of detail total) | 7, €56 | 7, 56 EUR | no currency; the Purchase goal has no value set, so Sources shows "–" |
| PostHog | 3 purchases, revenue 24 (trends insight, sum of revenue) | 3, €24 | 3, 24 EUR | summing total gave 0: you must know the property's name |
| Pirsch | Purchase 7; revenue only as metadata ("8" on 7 events) | 7, €56 | 7, 56 (no currency) | you multiply yourself |
| Matomo | 4 orders, €32 | 5, €40 | 4, 32 EUR | ecommerce report, not the event |
| GA4 | purchase 3, $26.44 (window) | 5 (window) | 3, "24 EUR" | converted to the property's USD without a word |
| LogRocket | 7 sessions reached /order-complete; no sum | 7 | 7 sessions, no revenue (asked back which property) | no revenue sum in the session list |
| Clarity | Purchase 4 sessions, no revenue | 7 | 4 sessions | – |
| Mouseflow | Purchase tag on 2 recorded sessions, "order placed" on 1, no amount | 5 | – | recorded sessions only |
| Cloudflare, Sentry | – | – |
Currency is the recurring trap.
- GA4 converts silently.
- Umami defaults its display to USD and shows zero.
- PostHog's base currency was left at USD.
- Three tools show no currency at all: Privatrak, Mixpanel and Pirsch.
9.11 Timezones: what "17 Nov" means
| Tool | Dashboard | MCP |
|---|---|---|
| Privatrak | UTC (the project's zone) | exact project days |
| Plausible | UTC (site zone); custom range in the URL | exact dates |
| Matomo | UTC; period=range&date=… | exact |
| PostHog | UTC; date_from / date_to | exact |
| Sentry | exact UTC range (utc=true) | relative only (7d) |
| Fathom | UTC (from=… 00:00:00&to=… 23:59:59) | – |
| Amplitude | UTC ("UTC+00:00" in the picker) | – |
| Mouseflow | UTC days | – |
| Umami | the picker gives UTC days; the URL holds the browser's midnights (range:1794848400000:… = 16 Nov 17:00 UTC), so an edited URL shifts the window by the browser's offset (38 visitors, 99 views, the 19 Nov run included) | – |
| Cloudflare | the browser's zone, but the absolute range takes times; 07:00-07:00 GMT+7 is exactly the UTC days | exact (GraphQL) |
| Clarity | the browser's zone; exact UTC only through millisecond timestamps in the URL | last 1-3 days only |
| LogRocket | dashboards in the browser's zone; the Session Replay list has a GMT+7/UTC switch | drifted into 19 Nov in five answers (Sonnet) |
| Pirsch | the domain's zone only (it was on Asia/Bangkok); no UTC days possible | UTC via timezone=UTC |
| GA4 | the property's zone only (it was on America/Los_Angeles) | the property's zone; Opus rebuilt UTC days from dateHour |
Consequences:
- GA4's "17-18 Nov" is 17 Nov 08:00 to 19 Nov 08:00 UTC. It leaves out day 1's main round and includes day 3 and the manual round.
- Pirsch's window is 16 Nov 17:00 to 18 Nov 17:00 UTC. It misses the before-midnight visits.
- Both lab tools ended up off UTC despite the setup rule. In both, the timezone setting was misleading:
- Pirsch's select kept showing the browser zone.
- GA4's change, recorded at setup, was not what the property used.
GA4's numbers move after the fact. The users, page views and funnel entries asked on 20 Nov were higher than the same window asked through MCP on 19 Nov at 09:25 UTC: 28 against 26 users, 105 against 94 views, and 13 against 11 funnel entries. The manual round happened two hours before the MCP run and was processed later. A GA4 answer about a finished day still depends on when it is asked.
9.12 Bots, automation and data-centre traffic
| Tool | What it did with automated or data-centre visits |
|---|---|
| Plausible | dropped every Playwright-Chromium visit (202 with x-plausible-dropped), on residential, VPN and data-centre exits alike; kept Firefox and most WebKit; kept a real Chrome; dropped one residential IP entirely in the check visit (reputation) |
| Clarity | "46 bot sessions excluded" for 17-18 Nov (49 on 15 Nov, partly r2's user-agent split) |
| Privatrak | stores and counts automated visits but marks them: 25 of 200 page views (12.5%) were automated; reports offer "by people" |
| Matomo | dropped 11 of 13 NordVPN visits (PacketHub, Datacamp networks) and, on 20 Nov, every visit from a laptop on the same VPN; kept the Singapore data-centre group and every marked and agent-like visit (chapter 10). With the 30-minute visit merge this explains its 49 of 78 |
| Mouseflow | records nothing from navigator.webdriver browsers (0 of 17 marked visits) |
| LogRocket | "block well-known bots" listed under Recording Settings |
| Fathom | bot blocking on by default |
| PostHog | its script mostly stops on navigator.webdriver (4 of 17 marked visits sent) |
| Others | no filtering of marked or agent-like visits; no tool flagged the agent-like visits or the Claude in Chrome agent (chapters 10 and 11) |
Per visit (chapter 10, "What the browsers themselves held back"): Plausible and Mouseflow sent nothing for the 17 marked visits, PostHog 4 of 17; every tool sent the 16 agent-like visits. The AI fetchers, link previews and the browser agent are in chapter 11.
9.13 Consent and blockers
| Effect | Size on 17-18 Nov | Tools affected |
|---|---|---|
| Consent declined | 30 visits | Matomo (17 lost), Sentry (18), Mixpanel (19), PostHog (16), Clarity (4), Amplitude (13 cancelled) |
| uBlock Origin Lite | 2 personas | blocks most tools' scripts; not Privatrak |
| Firefox strict tracking protection | 2 personas | blocks GA4 and several others |
| Do Not Track + GPC | 3 personas, 14 visits | Mixpanel and Clarity sent nothing; every other tool sent them. DNT alone (20 Nov agent visit): Mixpanel dropped it, Clarity recorded it (chapter 10) |
A test in October, with the same snippets checked against uBlock Origin defaults, EasyList + EasyPrivacy and AdGuard, found that every tool except Privatrak was blocked by all three lists. Privatrak was blocked by none, most likely because it is new and not yet listed.
9.14 Personal data on screen
- Full IP addresses as labels. LogRocket labels visitors by city, and one session by its full IP address, in the sessions list. Sentry labels each replay by the visitor's full IP. In the lab these are proxy and VPN exits; on a real site they would be visitors' IPs. None are reproduced in this report.
- Run labels in replays. Sentry's replays show landing URLs like
#r=r4-d1-p06-contact, recorded before the probe removes the hash. Counting tools never see it. - Pre-ticked options. GA4's setup pre-ticks three data-sharing options and four email preferences. Creating a key event pre-selects a 1 USD default value.
- Mouseflow's default. It records nothing until the account confirms that personal data is excluded.
- Privatrak stores no geodata, which is why it cannot answer the France question.
9.15 Data freshness and misleading empty states
- GA4 kept processing late data for a finished day (9.11).
- Fathom's "Last 7 days" view lagged behind "Today" (11 against 46 visitors on 15 Nov).
- Clarity processes with a delay of hours.
- Mixpanel's home page said "No users seen in the last week" and "No events found" while lab events arrived all week. Its project page's usage statistics said 0 events while the Events view listed 196.
- Pirsch's goals settings listed "0 Visitors, 0% CR" for goals that had conversions.
- Umami's start page and settings page show the login form even when you are signed in. The dashboard URL opens directly. An earlier round took the login form at face value.
- Umami's revenue page shows $0.00 until the currency is switched.
9.16 Dashboards against MCP
- Identical numbers where the server calls the same API as the dashboard: Privatrak, Matomo, Cloudflare and Mixpanel. For PostHog, the MCP matches the tables, not the headline.
- The dashboard can do more than the server:
- Plausible's UI shows revenue (€24) and the ordered funnel (8 → 1 → 1), where the server fails or cannot.
- Pirsch's UI funnel works (23 → 4 → 4), where the server's
funnelsmetric fails. - Clarity's UI can show exact UTC days through the URL, while its server is limited to the last 1-3 days.
- Sentry's UI names the dead-click element as a ready widget.
- The server can do more than the dashboard:
- Pirsch's server takes
timezone=UTC, so it gives UTC days the UI cannot. - GA4's server let Opus rebuild exact UTC days from hourly data.
- Pirsch's server takes
- LogRocket's UI was exact where the Sonnet MCP run drifted: 97 sessions, France 18, funnel pages 25 / 4 / 4, PDF 3, outbound 5, 404 5, purchases 7.
- Speed. For Mixpanel and Amplitude the dashboard is no faster than the server: every answer is a report to build either way.
10. All days in every tool
Chapters 7 and 8 asked ten questions about 17 and 18 Nov. This chapter reads each tool for the whole series: 17-20 Nov as one window and day by day, the manual round (19 Nov), the visits that are not in the manifest, and where the tool reaches back, the earlier series' days (15 Nov r2, 16 Nov r3). It also covers what the browsers themselves held back, what the 15 tools cost a visitor, and the comparison areas beyond counting. Expected numbers are each tool's delivered visits (chapter 5) plus the unlabelled extras below. The MCP-read tools are summarised in one section; their full answers are Appendix G.
Extras on top of the manifest (each tool may or may not have received them; there is no per-request record):
- 17-18 Nov: p14's new tab (+1 page view, same visitor), the Click Map visit on 18 Nov 11:11 UTC (+1 visitor, 4 page views, Thailand, referrer app.privatrak.com), an unknown visitor on 18 Nov 17:56 UTC (+1 visitor, 2 page views). Privatrak holds the new tab, nothing of the Click Map visit and 1 page view of the unknown one (checked event by event, chapter 5).
- 19 Nov: the manual round, 4 visits (+5 visitors for IP+UA tools: the phone's IP changed), 17 page loads. Privatrak holds 12 page views of it.
- 20 Nov: the stray visit from Cloudflare's site list (+1 visitor, 1 page view, 1.5 s). Privatrak holds nothing of it. The Click Map visit, the stray visit and the manual round's Chrome visit were made in our own browser, which blocks Privatrak's ingest so that we do not track ourselves; hence Privatrak's missing visits.
- 20 Nov from 11:44 UTC: the AI and app rounds, two page-weight runs and a diagnostic page view (chapter 11). Most per-tool tables here were read before them; Amplitude (~12:00), Mouseflow (~12:10) and Clarity (~12:20) were read during the rounds, so their 20 Nov rows may hold the first of these visits.
10.1 Fathom (read 20 Nov, ~11:40 UTC)
Dashboard, custom range in UTC (from=… 00:00:00&to=… 23:59:59).
| Window | Site visitors | Pageviews | Expected visitors (person-days, pd, + extras) | Expected pageviews (+ extras) | Events |
|---|---|---|---|---|---|
| 15 Nov (r2) | 46 | 123 | 46 pd | 139 | 12 completions |
| 16 Nov (r3) | 49 | 174 | 46 pd | 195 | 28 completions |
| 17-18 Nov | 71 | 174 | 68 + 2 = 70 | 194 + 7 = 201 | Purchase 7 (€56), 404 5 |
| 19 Nov | 13 | 35 | 9 + 4-5 = 13-14 | 28 + 17 = 45 | Plan selected 4, Purchase 2 (€16) |
| 20 Nov | 11 | 29 | 10 + 1 = 11 | 28 + 1 = 29 | none (no purchase that day: right) |
| 17-20 Nov | 95 | 238 | 87 + 8 = 95 | 250 + 25 = 275 | Plan selected 11, Purchase 9 (€72), 404 5 |
- Visitors are exact once the extras are counted, on every day and over the window: 17-20 Nov's 95 = 87 person-days + the 8 extra visitor-days.
- A range's visitors are the sum of the days' visitors. 17-20 Nov is 71 + 13 + 11 = 95, so a persona that came on four days is four visitors. Fathom recognises nobody across days (daily salt), as documented.
- Page views fall short where they come in bursts. On 20 Nov they are exact (29); on 17-18 Nov 27 are missing, on 19 Nov 10 (the manual round's reloads and the phone's quick repeats are the likely part). Open: which page views Fathom leaves out.
- Revenue exact: €56 on 17-18 Nov, €16 on 19 Nov, €72 over the window.
- France: 3 on 19 Nov (3 expected), 4 on 20 Nov (4), 22 over 17-20 Nov (26 visits, 19 person-days).
- Brazil 22 over 17-20 Nov, and 2 on 19 Nov, when no data-centre or VPN visit ran (only residential US/GB/DE/FR personas and the manual round). So Fathom puts some residential proxy IPs in Brazil too, not only the NordVPN Singapore exits.
- Thailand: 2 on 19 Nov (the manual round is 4 visits from two IPs), 1 on 20 Nov (the stray visit).
- Devices 17-20 Nov: desktop 79, phone 16. Browsers: Chrome 45, Safari 27, Firefox 22, Edge 1.
- Sources 17-20 Nov: Direct / Unknown 27, Google 14, LinkedIn 13, news.ycombinator.com 8, DuckDuckGo 7, Perplexity 6, Bing 5, Reddit 5, X 5, chatgpt.com 4. Campaigns (UTM): "No data to display", although the newsletter and ads visits carried utm_campaign.
- Returning visitors: Fathom has no new-vs-returning report.
10.2 Plausible (read 20 Nov, ~11:00 UTC)
Dashboard, period=custom&from=…&to=… and period=day&date=…, site on UTC.
Expected = Plausible's delivered visits (non-Chromium only, chapter 5) plus
the extras, which are real browsers Plausible keeps.
| Window | Unique visitors | Visits | Pageviews | Expected visitors (pd + extras) | Expected pageviews |
|---|---|---|---|---|---|
| 15 Nov (r2) | 18 | 18 | 41 | 16 pd (25 visits) | 39 |
| 16 Nov (r3) | 20 | 22 | 92 | 17 pd (42 visits) | 88 |
| 17-18 Nov | 31 | 31 | 77 | 26 + 2 = 28 | 71 + 7 = 78 |
| 19 Nov | 10 | 10 | 28 | 3 + 4-5 = 7-8 | 11 + 17 = 28 |
| 20 Nov | 5 | 5 | 12 | 4 + 1 = 5 | 11 + 1 = 12 |
| 17-20 Nov | 46 | 46 | 117 | 33 + 8 = 41 | 93 + 25 = 118 |
- Page views are exact or within one on every r4 day once the extras count (77/78, 28/28, 12/12, 117/118). So Plausible did keep the Click Map visit, the manual round and the stray visit: real Chrome and Safari.
- Visitors run a few over on the days with IP changes (17-18 Nov +3, 19 Nov +2-3: the phone switched IP mid-visit; on 18 Nov p19 did).
- A range's visitors are the sum of its days (31 + 10 + 5 = 46): no recognition across days, as documented (daily salt).
- r2 and r3 days read close to delivery (41/39 and 92/88 page views), r2's user-agent split adding visitors (18 for 16 person-days).
- Sources 19 Nov: Direct 6 (the manual round had no referrers), Google 3, X 1.
10.3 Umami Cloud (read 20 Nov, ~11:05 UTC)
Dashboard, read with the date picker, which gives UTC days (an edited URL would not, chapter 7).
| Window | Visitors | Visits | Views | Expected visitors | Expected views |
|---|---|---|---|---|---|
| 17-18 Nov | 64 | 71 | 166 | 66 pd + 2 = 68 (83 visits) | 164 + 7 = 171 |
| 19 Nov | 12 | 12 | 40 | 8 + 4-5 = 12-13 | 27 + 17 = 44 |
| 20 Nov | 10 | 10 | 26 | 9 + 1 = 10 | 25 + 1 = 26 |
| 17-20 Nov | 86 | 93 | 232 | 83 + 8 = 91 | 216 + 25 = 241 |
- 20 Nov exact (10 visitors, 26 views); 19 Nov within one visitor, 4 views short.
- Thailand 4 on 19 Nov (the manual round: two laptops on one line, the phone before and after its IP switch, P2 merged with P1's second IP), 1 on 20 Nov (the stray visit), 6 over 17-20 Nov (+ the Click Map visit).
- France 3 on 19 Nov, 4 on 20 Nov: exact. Singapore 6 over 17-20 Nov (the data-centre group).
- 17-20 Nov's 86 visitors = 64 + 12 + 10, the sum of the days. Umami's salt rotates monthly, so it could recognise a returning visitor, but every returning persona came from a new IP each day; only the midnight pair kept its IP.
app.privatrak.com1 in Referrers: the Click Map visit.
10.4 Pirsch (read 20 Nov, ~11:30 UTC, through its API with tz=UTC)
Pirsch's dashboard can only show the domain's zone (Asia/Bangkok), so these
are read through its statistics API (/statistics/total, /country) with
tz=UTC, with the OAuth client the MCP server uses.
| Window | Visitors | Sessions | Views | Expected visitors (pd + extras) | Expected views |
|---|---|---|---|---|---|
| 15 Nov (r2) | 43 | 53 | 132 | 46 pd (74 visits) | 137 |
| 16 Nov (r3) | 47 | 63 | 201 | 46 pd (97 visits) | 197 |
| 17-18 Nov | 64 | 79 | 195 | 68 + 2 = 70 | 194 + 7 = 201 |
| 19 Nov | 13 | 14 | 41 | 9 + 4-5 = 13-14 | 28 + 17 = 45 |
| 20 Nov | 11 | 11 | 29 | 10 + 1 = 11 | 28 + 1 = 29 |
| 17-20 Nov | 88 | 104 | 265 | 87 + 8 = 95 | 250 + 25 = 275 |
- 20 Nov exact; 19 Nov exact on visitors, 4 views short (the manual round's quick reloads, as in Umami).
- France exact on 19 and 20 Nov (3, 4); Thailand 4 on 19 Nov, 1 on 20 Nov, 1 on 17-18 Nov (the Click Map visit). No Brazil anywhere: Pirsch places the exits Fathom calls Brazil correctly.
- 17-20 Nov's 88 = 64 + 13 + 11: no recognition across days (a visitor hash includes the date).
10.5 Matomo Cloud (read 20 Nov, ~11:35 UTC, through its Reporting API)
VisitsSummary.get, VisitFrequency.get, UserCountry.getCountry,
Actions.get. Matomo identifies visitors by
the _pk_id cookie, which the persona state files carried across days.
| Window | Visits | Returning visits | Page views | Expected visits | Expected returning | Expected page views |
|---|---|---|---|---|---|---|
| 15 Nov (r2) | 28 | 2 | 71 | 64 (44 pd) | – | 123 |
| 16 Nov (r3) | 36 | 3 | 102 | 77 (44 pd) | – | 161 |
| 17-18 Nov | 49 | 10 | 117 actions | 78 (58 pd) | – | 150 |
| 19 Nov | 8 | 6 | 19 | 6 + 2 (manual round) | 6 | 23 + manual |
| 20 Nov | 7 | 6 | 16 | 6 + 1 (stray) | 6 | 16 + 1 |
| 17-20 Nov | 64 | 22 | 138 | 90 (70 pd) | 189 |
- The first tool that recognises returning visitors, and exactly: all 6 lab visits on 19 Nov and all 6 on 20 Nov are "returning" (every one is a persona Matomo had seen before, through its cookie), and the new visits are the manual round (2: Thailand) and the stray visit (1). The cookie-less tools above count every one of them as new.
- On 19 and 20 Nov Matomo counts every visit it was sent; the 17-18 Nov
undercount (49 of 78) is concentrated on the day-1 burst. Part of it is
Matomo's 30-minute visit: a persona's lab visits within 30 minutes of each
other are one visit in a cookie tool. Grouping the delivered visits that way
gives 59 for 17-18 Nov, not 78. The rest is VPN visits: matching
Matomo's visitor log (
Live.getLastVisitsDetails, 74 visits 17-20 Nov) against the 89 r4 visits Matomo was sent (by time and landing page, published with the data) leaves 12 visits with no Matomo visit: 11 of the 13 NordVPN visits (exits on PacketHub S.A. in DE, GB, US and Datacamp in the US; every browser and every consent choice) and 1 residential visit. Matomo kept all 10 data-centre visits (NordVPN Singapore, GSL Networks), both Clouvider (GB) visits and one PacketHub visit, and every marked and agent-like visit. On 20 Nov it also dropped the Claude in Chrome visit and the two page-weight runs, which came from a laptop on the same PacketHub DE network. Matomo's script answered 204 to all of them. No IP or user agent is excluded in the site or global settings; the system settings (where a spam-prevention or IP-range filter would sit) are not readable with our access, so the mechanism is not identified. 10 Matomo visits hold two manifest visits each (the 30-minute merge). - Singapore 10 on 17-18 Nov: Matomo counted all 10 data-centre visits (it dropped the pilot's in its first days).
- France 2 on 19 Nov (3 sent: one fewer), 3 on 20 Nov (exact).
For every tool, visits grouped by a 30-minute gap per persona (the session rule of most cookie tools), 17-18 Nov, delivered visits: Matomo 77 → 59, PostHog 65 → 51, Mixpanel 68 → 52, Amplitude 81 → 62, Clarity 82 → 61, Mouseflow 80 → 59, LogRocket 95 → 69, GA4 90 → 67, Cloudflare 93 → 68, Umami 81 → 68, Pirsch 97 → 71, Fathom 97 → 71, Plausible 37 → 26. A tool's "visits" or "sessions" should sit between the two numbers, depending on how it cuts a visit.
10.6 Expected numbers for every tool and window
The published expected-all.json holds, per tool and
window, the delivered visits, personas, person-days, page views, France,
funnel, downloads, outbound, 404 and purchases, and for cookie tools the
returning visit-days: delivered visits whose persona had an earlier
delivered visit to the same tool on an earlier day. The extras (visits not in
the manifest) come on top: 17-18 Nov 2 visitors / 7 page views, 19 Nov 4-5 / 17,
20 Nov 1 / 1. The 15 and 16 Nov windows include series r2 and r3 and the check
visits of those days.
10.7 Amplitude (read 20 Nov, ~12:00 UTC, Marketing Analytics, UTC range in the URL)
| Window | Visitors (uniques) | Sessions | Page views | Expected personas / pd | Expected page views |
|---|---|---|---|---|---|
| 15 Nov (r2) | 37 | 38 | 86 | 38 pd | 113 |
| 16 Nov (r3) | 40 | 42 | 120 | 40 pd | 156 |
| 17-18 Nov | 39 | 54 | 131 | 41 personas, 60 pd | 164 + 7 |
| 19 Nov | 9 | 9 | 30 | 7 + manual round | 24 + 17 |
| 20 Nov | 7 | 7 | 17 | 7 + 1 | 20 + 1 |
| 17-20 Nov | 42 | 70 | 178 | 41 personas (+ extras) | 208 + 25 |
- Amplitude recognises visitors across days: 39 + 9 + 7 = 55 day-visitors, but 42 over the four days, so 13 visitors were recognised as the same person on another day. 42 sits right at the 41 personas it was sent plus the few extra browsers. (Amplitude keeps a device ID in browser storage; the persona state files carried it.)
- Page views are short of delivery throughout (consent: the decliners' later events stop; the expected numbers are upper bounds), and exact in sum: 131 + 30 + 17 = 178.
10.8 Mouseflow (read 20 Nov, ~12:10 UTC, "Your first dashboard", fromdate/todate)
| Window | Visitors | Sessions | Page views | Expected personas / pd | Expected page views |
|---|---|---|---|---|---|
| 15 Nov (r2) | 40 | 41 | 92 | 39 pd | 117 |
| 16 Nov (r3) | 45 | 48 | 113 | 39 pd | 176 |
| 17-18 Nov | 40 | 55 | 111 | 38 personas, 58 pd | 165 + 7 |
| 19 Nov | 7 | 7 | 19 | 6 + manual round | 18 + 17 |
| 20 Nov | 5 | 5 | 11 | 7 + 1 | 20 + 1 |
| 17-20 Nov | 43 | 67 | 141 | 38 personas (+ extras) | 203 + 25 |
- Mouseflow recognises visitors across days too: 40 + 7 + 5 = 52 day-visitors, 43 over the window (9 recognised).
- Counts are recorded sessions only (500 a month on the free plan), so page views stay well under delivery, worst on 20 Nov (11 of 21).
10.9 Microsoft Clarity (read 20 Nov, ~12:20 UTC, dashboard, date=Custom&start=…&end=… in UTC milliseconds)
| Window | Sessions | Bot sessions excluded | Unique users | Sessions with returning users | Pages per session | Expected visits | Expected returning |
|---|---|---|---|---|---|---|---|
| 15 Nov (r2) | 77 | 30 | 75 | 2 | 1.27 | 41 pd (r2 + checks) | – |
| 16 Nov (r3) | 134 | 27 | 128 | 0 | 1.31 | 41 pd | – |
| 17-18 Nov | 112 | 46 | 108 | 2 | 1.14 | 84 visits | 15 same-day |
| 19 Nov | 27 | 7 | 26 | 1 | 1.15 | 6 + manual round | 6 |
| 20 Nov | 17 | 4 | 16 | 2 | 1.06 | 7 + 1 | 7 |
| 17-20 Nov | 156 | 57 | 148 | 5 | 1.13 | 97 visits, 40 personas | 33 |
- Clarity recognises almost nobody: 148 unique users over four days for
40 personas (+ extras), and 5 returning sessions where 33 returning
visit-days were sent. This is consistent with what the page-weight runs
showed: Clarity sets its
_clckcookie only after consent, and most personas ignored or declined the banner. - More sessions than visits every day (27 on 19 Nov for about 10 visits, 17 on 20 Nov for 8): Clarity cuts sessions finer than a visit, as on 17-18 Nov.
- Bot sessions excluded on every day, also on 19-20 Nov when only residential person-like visits and real people came: 7 and 4.
- 17-20 Nov: Smart events Submit form 12, Order success 10, Checkout 10,
Plan selected 7, Search 5, Purchase 5 + 5 (its own and ours), Outbound
click 4; JavaScript errors "lab: save draft failed" 3; dead clicks in 4
sessions, rage clicks 0; Contact funnel 25 → 0 → 0; referrers led by the
site itself (68),
app.privatrak.com1 (the Click Map visit).
10.10 The tools read through their MCP servers (20 Nov, ~11:40-12:40 UTC)
PostHog, Mixpanel, Privatrak, Cloudflare, LogRocket, Sentry and Clarity were read by a headless assistant (Claude Code, Opus) per server, read-only, with one brief (the six windows, the ten areas, the midnight hours and the manual round's hour). Their full answers are in Appendix G. GA4's server was read the same way after a fresh sign-in; its windows are its own (Los Angeles days rebuilt into UTC from hourly data).
Windows: W1 15 Nov, W2 16 Nov, W3 17-18 Nov, W4 19 Nov, W5 20 Nov (to the read time), W6 17-20 Nov. Visitors / sessions or visits / page views per window:
| Tool | W1 15 Nov | W2 16 Nov | W3 17-18 Nov | W4 19 Nov | W5 20 Nov | W6 17-20 Nov |
|---|---|---|---|---|---|---|
| PostHog (persons / sessions / page views) | 41 / 42 / 84 | 45 / 47 / 116 | 41 / 53 / 106 | 9 / 9 / 20 | 5 / 5 / 12 | 45 / 67 / 138 |
| Mixpanel (users / sessions / page views) | 43 / 43 / 104 | 46 / 48 / 134 | 40 / 54 / 124 | 6 / 6 / 23 | 4 / 4 / 12 | 41 / 64 / 159 |
| Privatrak (visitors / page views; automated) | 62 / 145; 17 | 50 / 208; 17 | 72 / 200; 25 | 13 / 43; 9 | 10 / 28; 5 | 95 / 271; 39 |
| Cloudflare (visits / page views) | 56 / 103 | 78 / 161 | 95 / 196 | 15 / 42 | 10 / 26 | 120 / 264 |
| LogRocket (users / sessions / page views) | 39 / 56 / 110 | 43 / 63 / 166 | 47 / 98 / 199 | 14 / 14 / 42 | 11 / 11 / 29 | 51 / 123 / 270 |
| Sentry (replays / distinct IPs) | 62 / 31 | 74 / 31 | 78 / 43 | 10 / 9 | 7 / 7 | 95 / 59 |
| Clarity (users / sessions / page views) | 75 / 77 / 98 | 128 / 134 / 176 | 108 / 112 / 128 | 26 / 27 / 31 | 16 / 17 / 18 | 148 / 156 / 177 |
(Clarity's MCP numbers equal its dashboard's above. W5 was read at about 11:40 UTC, with nothing after day 4's run but the stray visit.)
- Who recognises a visitor across days (W6 against the sum of the days): PostHog 45 for 67 day-visitors, Mixpanel 41 for 63, LogRocket 51 for 95, Amplitude 42 for 55, Mouseflow 43 for 52, Matomo returning 6 of 6 and 6 of 6 on 19-20 Nov. Nobody recognises across days: Privatrak (95 = 47 + 25 + 13 + 10), Fathom, Plausible, Umami, Pirsch (all by design: daily hashes), Cloudflare (no visitor concept) and Clarity (148 users for 40 personas; 5 returning sessions), the one cookie tool that does not.
- PostHog and Mixpanel name returning visitors on 19-20 Nov: PostHog 5 of 9 seen before on 19 Nov (the other 4 are the manual round) and 5 of 5 on 20 Nov; Mixpanel 5 of 6 and 4 of 4.
- The series start fresh: LogRocket's users of W1, W2 and W6 add up to the whole period's, so no user carried over from r2 to r3 to r4, as the runner intended (empty browser state per series).
- The midnight pair (17 Nov 23:00 to 18 Nov 01:00): PostHog, Mixpanel and LogRocket count the same visitor in both hours and once in the window (cookie); Sentry has the same 2 IPs in both hours as new replays; Privatrak counts a visitor active on both sides of midnight on both days (daily key); Cloudflare counts each visit once in the hour it began; Clarity had different users in the two hours (0 in both).
- The manual round (19 Nov 07:00-08:00): PostHog 5 visitors / 5 sessions / 10 page views, all Thailand (3 Mobile Safari, 1 Chrome, 1 Safari: the phone's IP switch makes it two); LogRocket 5 users, all Thailand; Cloudflare 7 visits; Mixpanel 1 visitor (Safari on the Mac: the Chrome visit came from our work browser, which sends Do Not Track, and the phone declined the consent banner); Clarity 17 sessions / 16 users from Thailand: it split the phone's quick reloads into sessions of their own.
- Brazil: Sentry puts 21 of 78 replays of 17-18 Nov and 2 on 19 Nov in Brazil, like Fathom. PostHog, Mixpanel, LogRocket, Cloudflare, Clarity, Pirsch and Umami have no Brazil at all. Two geolocation databases place some of the residential proxy exits in Brazil.
- Singapore: 10 visitors on 17-18 Nov in PostHog, Mixpanel (9), LogRocket, Cloudflare, Clarity, Matomo: the data-centre group, kept.
- Privatrak marks automated page views and keeps them: 25 of 200 on 17-18 Nov, 9 of 43 on 19 Nov (the residential "marked" and "agent" personas; none of the manual round).
- Privatrak's 15 Nov: 62 visitors of which 15 have no page view (r2's split user agent: the leave-time events ran under another visitor ID).
10.11 What the browsers themselves held back
What each tool's script did for the visitors it is meant to respect or filter, all r4 visits (requests answered 2xx = "sent"):
| Visitor type | Visits | Tools that sent nothing | Notes |
|---|---|---|---|
| Do Not Track + GPC (p05, p11, p17) | 14 | Mixpanel (0 of 14), Clarity (0 of 14) | every other tool sent all of them (Matomo, PostHog, Sentry missed 3: those were declines) |
navigator.webdriver (marked) | 17 | Plausible (0 of 17), Mouseflow (0 of 17), PostHog (4 of 17) | Plausible's and Mouseflow's scripts stop on webdriver; PostHog's mostly |
| agent-like (markers hidden, program-like input) | 16 | none | everyone sent; Plausible dropped 10 server-side (Chromium) |
| uBlock Origin Lite | 5 | all but Privatrak | 14 scripts blocked; Privatrak's not on the lists |
| Firefox strict tracking protection | 6 | all but Privatrak, Pirsch, LogRocket (4 of 6), Fathom | GA4 blocked outright |
| data-centre exit (NordVPN Singapore) | 10 | none client-side | Plausible dropped 9 server-side |
| VPN exits | 15 | none client-side | Plausible dropped 10 server-side |
So of the tools, Mixpanel honours Do Not Track, and Clarity sends nothing for visitors with both Do Not Track and Global Privacy Control (with Do Not Track alone it recorded a visit, chapter 11); "ignores automated browsers" is true of Plausible and Mouseflow (and mostly PostHog) at the script, and of Clarity afterwards ("bot sessions excluded"). Privatrak stores them and marks them.
10.12 What the 15 tools cost a visitor (20 Nov, 12:13 UTC)
One 3-page visit (/, /article, /pricing, 8 s each) in headed Playwright
Chromium from the laptop, once ignoring the consent banner and once accepting
it; both are labelled visits (weight-ignore, weight-accept) and recorded
as extras. Bytes are transferred sizes (headers + bodies) per tool's hosts.
| Tool | Requests | Downloaded | Uploaded | Hosts |
|---|---|---|---|---|
| Amplitude | 27 | 309 KB | 14 KB | cdn, sr-client-cfg, api2.amplitude.com |
| PostHog | 15 | 254 KB | 5 KB | eu-assets.i.posthog.com |
| GA4 (GTM container) | 7-9 | 183 KB | 6-8 KB | googletagmanager.com, region1.google-analytics.com |
| LogRocket | 10-12 | 150 KB | 147-153 KB | cdn/r.lr-ingest.com |
| Mixpanel | 10-11 | 142 KB | 8-12 KB | cdn.mxpnl.com, api-eu.mixpanel.com |
| Sentry | 9 | 77 KB | 27 KB | sentry-cdn.com, ingest |
| Matomo | 12-14 | 64 KB | 10-12 KB | cdn.matomo.cloud, the instance |
| Mouseflow | 3 | 55 KB | 2 KB | cdn.mouseflow.com |
| Clarity | 10-13 | 30 KB | 13-15 KB | clarity.ms (+ bing.com after consent) |
| Privatrak | 9-10 | 20 KB | 6-7 KB | api.privatrak.com |
| Cloudflare | 6 | 10 KB | 5 KB | cloudflareinsights.com |
| Umami | 6 | 7.5 KB | 3.7 KB | cloud.umami.is, gateway.umami.is |
| Fathom | 6 | 4.8 KB | 4.0 KB | cdn.usefathom.com |
| Pirsch | 6 | 4.1 KB | 2.9 KB | api.pirsch.io |
| Plausible | 3 | 3.2 KB | 0.8 KB | plausible.io |
| All 15 | 141-148 | 1,315 KB | for a 3-page visit |
Cookies. Ignoring the banner already leaves 11 cookies (no tool was told
to wait for consent; the lab sets no consent defaults): Matomo _pk_id
(393 days) and _pk_ses, GA4 _ga and _ga_… (400 days), Amplitude
AMP_…, AMP_MKTG_… and EXP_…_identity (365 days), Mixpanel mp_… (365),
PostHog ph_…_posthog (365), LogRocket _lr_tabs_ and _lr_hb_ (1 day).
GA4, Amplitude, Mixpanel and PostHog set theirs on .privatrak.com, the
whole parent domain (so the dashboard at app.privatrak.com receives them
too). Accepting adds 11 more: Clarity's _clck and _clsk appear only
after consent, with Microsoft's MUID on .clarity.ms and .bing.com,
and Matomo's mtm_consent and _pk_hsr. Clarity's missing cookie without
consent is why it recognised almost nobody across days (Clarity section
above): most personas ignored or declined the banner.
Browser storage on the site's origin (local / session), without consent:
Mixpanel __mprec_…, __mpq_…, mp_tab_id_…; Amplitude AMP_unsent_…,
AMP_remote_config_…, AMP_SR_START_…, EXP_…, AMP_PAGE_VIEW,
AMP_URL_INFO; PostHog ph_…_posthog, …_window_id,
…_session_registered_properties; LogRocket _lr_id_, _lr_dat_,
__lr_navigation_history_v1, _lr5_; Sentry sentryReplaySession; after
consent also __mp_opt_in_out_…, __ph_opt_in_out_… and Clarity _cltk.
Privatrak, Plausible, Fathom, Umami, Pirsch and Cloudflare stored nothing.
10.13 The comparison areas, 17-18 Nov (what each tool reports beyond counting)
Bounce rate. 57 of the 102 r4 visits on 17-18 Nov saw one page (56%); 26 of those also clicked nothing (25%: a lab visit clicks a button on its one page, a download or outbound visit clicks a link).
| Tool | Bounce rate 17-18 Nov | What it counts |
|---|---|---|
| Clarity | 92.9% | sessions with one page view (its sessions are cut finer than visits) |
| LogRocket | 52.0% | single-page sessions |
| Matomo | 39% | visits with one action (a download or outlink is an action) |
| Pirsch | 38.0% | sessions with one page view |
| Amplitude | 35.2% | sessions with one page view |
| Plausible | 13% | visits with one page and no engagement event |
| PostHog | 3.8% | sessions with one page view and under 10 s, no autocapture |
| Truth | 56% single-page, 25% single-page without a click |
So the same visits read as anything from 4% to 93% bounce.
Single-page-app routes (/app/forms, /app/answers, /app/settings
by history.pushState): counted by Privatrak, Cloudflare, Clarity, Pirsch,
Sentry (replays), Matomo (as /app actions), Fathom and Umami; PostHog
shows only /app (4 views on 17-18 Nov, none of the routes), so its default
setup records no pushState page views.
Query strings: kept as separate pages by Matomo (/product?id=booking 5,
/product?id=quote 5, /?ref=producthunt 3, /article?ref=producthunt 1),
Mixpanel (a property: ?ref=producthunt 5, ?id=booking 4, ?id=quote 4,
?q=quote 3) and Sentry (/checkout?plan=team); stripped by Privatrak,
Plausible, Pirsch, Cloudflare, Clarity ("no query strings stored"), PostHog,
Umami and Fathom. Pirsch kept a URL fragment as a page:
/#st-picker=https://app.privatrak.com&mode=click-map (the Click Map visit),
so a hash can end up in its page list.
UTM campaigns (newsletter November-Launch, ads forms-us, ChatGPT
utm_source=chatgpt.com): reported by Privatrak, PostHog, Mixpanel, Plausible,
Pirsch, Matomo ("Campaigns" channel 6), LogRocket and Clarity; Fathom shows
"No data to display" for campaigns; Cloudflare has no campaign report.
On 20 Nov the ChatGPT app appended utm_source=chatgpt.com to the link by
itself, so the app visit is attributable where the in-app browsers of
WhatsApp and iMessage sent no referrer at all.
Error, slow and dead clicks per element on /lab (truth: "Duplicate form"
dead in 7 visits and rage in 4; "Save draft" throws a TypeError):
| Tool | "Duplicate form" | "Save draft" (error) | Others |
|---|---|---|---|
| Privatrak | 7 dead, 4 rage | 2 error, 2 dead, 1 rage | Delete form 2 dead; chart 2 dead; card 2 dead; slow 0 |
| PostHog (SQL) | 6 dead, 1 rage | 2 dead, 1 rage | Publish form 1 dead, 1 rage |
| Mixpanel | button#b 11 dead, 1 rage | button#a 4 dead | |
| Sentry | button#b 4 dead (replays) | 2 errors ("lab: save draft failed") | 1 Mouseflow load error |
| Clarity | not flagged (11 plain clicks in the heatmap) | 9 error clicks (3 JS errors) | paragraph 9 dead, new-tab link 1 dead |
| Mouseflow (heatmap, 7 days) | 17 clicks | 15 clicks with an error mark | Publish form 10, chart 10 |
| Matomo (heatmap, 7 days) | button#b 31 clicks | button#a 13 clicks | no dead/rage notion |
| Amplitude (17-18 Nov) | 5 dead | 2 dead | Delete form 2, Publish form 1 |
| LogRocket | 7 dead sessions | – | rage: none found |
No tool reported a slow click on "Publish form" (it answers after a delay).
Devices and browsers 17-20 Nov. The personas' engines were Chromium 64, WebKit 32, Firefox 26 visits; the tools name them Chrome / Safari / Firefox / Edge and Mobile Safari. Plausible's browser split (Safari 24, Firefox 18, Chrome 6) is the non-Chromium remainder plus the real Chrome visits; GA4, PostHog, Mixpanel, LogRocket, Cloudflare and Pirsch split close to the engines.
11. Server-side feeds, Cloudflare, and the AI and app rounds
AI assistants' fetchers run no JavaScript, so none of the 15 snippets sees them. Before the AI rounds the lab therefore got a server-side feed into every tool that documents one, and a CDN in front that classifies bots at the edge. Then the rounds ran: AI assistants fetching a page for a person, a browser agent, and links opened from phone apps. Everything in this chapter happened on 20 Nov 2026, after series r4's last visits. The MCP answers behind it are Appendix H.
11.1 The server-side sender
A small program beside the web server read the site's access log and passed each request on to every tool with a documented server-side path, each the way its own docs describe:
| Tool | Requests | How |
|---|---|---|
| Privatrak | every request but the probe; its reporter keeps crawler page requests (its own pattern list) | @privatrak/tracker/server → POST /api/server-requests |
| Matomo | GET requests from Matomo's seven documented AI chatbot user agents, static files left out | HTTP Tracking API, bot mode (recMode=1): AI Chatbots reports, no visits |
| PostHog | every request but the probe and page assets | $http_log events (/batch/), classified at query time |
| Mixpanel | HTML pages answered to a crawler-list user agent | /import, $mp_web_page_view with $mp_raw_user_agent |
| Plausible | same | Events API pageview with the crawler's user agent |
| Pirsch | same | hit/batch, client-credentials token |
| Umami | same | gateway.umami.is/api/send |
| GA4 | same | Measurement Protocol page_view with user_agent and ip_override |
| Amplitude | same | HTTP V2 [Amplitude] Page Viewed |
The page-view APIs stand in for the script on a backend, so they got only crawler pages (Privatrak's published crawler list, which leaves out browser-like and automation patterns); otherwise every person would count twice. Our own uptime check (SentryUptimeBot, about one request a minute) was left out for them. Fathom, Clarity, Mouseflow, LogRocket, Sentry and Cloudflare Web Analytics document no server-side page or request ingestion. Clarity's one server-side path, Bot Activity, shows a CDN's logs (Cloudflare's, here), which this chapter reads at the source instead. Addresses reached the tools cut to the network (/24, /48), as the access log stores them. The send log, one line per request with the tool's answer and its own verdict where it gives one, is published (server-side-sends.jsonl).
11.2 Cloudflare in front of the site
- From 11:10 UTC the site ran behind Cloudflare (free plan), only this hostname proxied. Before the switch, the access log was set to cut the visitor address Cloudflare passes on (
Cf-Connecting-Ip) to the network, as for every other address. - Settings: SSL Full (strict); Bot Fight Mode, AI Labyrinth, Browser Integrity Check, Email Obfuscation, robots.txt management, Markdown for Agents, Speed Brain and Rocket Loader off; every AI crawler and agent allowed.
- Cloudflare injected its own beacon on activation. HTML served to browsers carried Cloudflare's real-user-monitoring script (
beacon.min.js, a new token, not the site's Web Analytics), although its Speed settings showed it as disabled. Found by comparing pages through Cloudflare with the origin; switched off completely at 11:20 UTC, pages byte-identical to the origin since. No visit ran in between. - Cloudflare adds its country per request (
Cf-Ipcountry), which this chapter quotes.
11.3 The rounds as they ran
Ground truth: the access log (with Cloudflare's country per request) and the probe's #r= labels where a page ran scripts.
| Time (UTC) | Round | What reached the site |
|---|---|---|
| 11:44:48 | ChatGPT (free account): "open …/article?via=chatgpt and summarise" | ChatGPT-User/1.0 fetched /article?via=chatgpt and / (Cloudflare: NL); summary correct |
| 11:45 | Perplexity (free, Search): the same prompt with via=perplexity | no page fetch; one /robots.txt with a Mac Chrome user agent; Perplexity answered that it couldn't retrieve the page and summarised Privatrak's site instead |
| 11:47:10 | Claude, through Claude Code's web fetch tool | Claude-User (claude-code/…) fetched /article?via=claude-code-webfetch (DE) |
| 11:49 | Claude in Chrome, an AI agent driving a real Chrome | /?via=claude-in-chrome → /pricing → /contact, scripts ran, no form sent |
| – | ChatGPT agent mode, Perplexity Computer | need paid plans; not run |
| 11:53 | heatmap viewers (Clarity, Mouseflow, LogRocket) | no page loads: Clarity renders its stored snapshot; Mouseflow fetched /style.css 4× (Mouseflow/1.0.0); LogRocket's LogRocket-AssetCacher fetched /style.css at 11:49 |
| 11:56-11:57 | iPhone (on Wi-Fi), a link sent in WhatsApp (a Slack URL) | WhatsApp/2.23.20.0 link preview (206), then Safari: 6 pages, no referrer |
| 11:58 | iPhone, a link in a ChatGPT app reply | Apple's link-preview fetcher (Mac OS X 10_11_1 … AppleWebKit/601.2.4) for the WhatsApp and ChatGPT links; then the app's browser opened /article?via=app-chatgpt&utm_source=chatgpt.com: the ChatGPT app appended utm_source=chatgpt.com itself; no referrer |
| 11:59-12:00 | iPhone, iMessage | Apple's link preview 2× and iOS NetworkingExtension asking for apple-touch-icon (404); then Safari, 5 pages, no referrer |
| 12:05:15 | Gemini app | user agent Google fetched /article?via=gemini (BE) |
| ~12:05 | Perplexity Comet (search; its agent needs a paid plan) | no fetch |
11.4 What every tool made of them (read 12:20-12:45 UTC)
What reached the site (access log, behind Cloudflare since 11:10; country is
Cloudflare's Cf-Ipcountry):
| Time | Request | Ran JS | Country |
|---|---|---|---|
| 11:44:48 | ChatGPT-User: /article?via=chatgpt, then / | no | NL |
| 11:45:18 | OAI-SearchBot: /robots.txt (not asked for) | no | US |
| 11:47:10 | Claude-User (Claude Code WebFetch): /article?via=claude-code-webfetch | no | DE |
| 11:49:07 | Claude in Chrome agent: /?via=claude-in-chrome → /pricing → /contact, real Chrome, DNT: 1 | yes | DE |
| 11:56:39 | WhatsApp/2.23.20.0 link preview: /article?via=app-slack | no | TH |
| 11:56:55 | iPhone, Slack link opened from WhatsApp, Safari: /article?via=app-slack, /article, /product, /pricing, /contact, /app | yes | TH |
| 11:58-11:59 | Apple link preview (Mac OS X 10_11_1 … facebookexternalhit/1.1 Facebot Twitterbot/1.0): 6 × /article?via=app-whatsapp/-chatgpt/-messages | no | TH |
| 11:58:39 | iPhone, ChatGPT app's in-app browser: /article?via=app-chatgpt&utm_source=chatgpt.com, /article, /pricing, /product; consent accepted | yes | TH |
| 11:59:48 | iPhone, iMessage link, Safari: /article?via=app-messages, /article, /product, /contact, /pricing | yes | TH |
| 12:05:15 | Gemini app fetch, user agent Google: /article?via=gemini | no | BE |
| 12:12:55 | page-weight runs (Playwright Chromium, webdriver: true): /?via=weight-ignore, /?via=weight-accept, each + /article, /pricing | yes | DE |
Perplexity (search) and Comet (search; its browser agent needs the Pro plan) made no request at all. The laptop used for the agent and the page-weight runs was on a VPN with a German exit (the same NordVPN network as the series' German VPN personas: Cloudflare DE; Umami, Plausible, PostHog, Mixpanel and LogRocket Germany; Fathom and Sentry: Brazil); the phone was in Thailand.
Two conditions shaped what the cookie tools saw, both checked:
- The two Safari visits ran with a stored consent decline. The phone
declined the banner in Safari on 19 Nov during the manual round; the site
keeps the choice in
localStorageand applies it on every load, so PostHog, Mixpanel and Amplitude were opted out, GA4 and Clarity told "denied", Mouseflow and Sentry's replay stopped. The ChatGPT app's browser has its own storage; there the banner showed and Accept was clicked. - The agent's Chrome sends Do Not Track (
DNT: 1, no GPC).
AI fetchers and link previews (no JavaScript; only server-side paths can see them)
What the server-side sender delivered (server-side-sends.jsonl) and what each
tool shows:
| Tool | Sent | ChatGPT-User (2) | Claude-User (1) | "Google" / Gemini (1) | Apple preview (6) | WhatsApp (1) |
|---|---|---|---|---|---|---|
| Privatrak | crawler pages (its list) | AI assistants: ChatGPT, 2 answer fetches, 0 visitors | Claude, 1 answer fetch | crawler ^Google$, purpose other, no assistant (Google does not document it) | crawler facebookexternalhit, /article 4 (5-s de-duplication merges same-page pairs) | not sent (not on its list) |
| Matomo | chatbot UAs only, bot mode | AI Chatbots "ChatGPT", 2 requests, no visit (real-time report; day report not yet archived) | "Claude", 1 | not sent (not a Matomo chatbot name) | not sent | not sent |
| PostHog | every request ($http_log) | AI Agent / ai_assistant / "ChatGPT" | AI Agent / "Claude User" | Regular (not recognised as a bot) | Bot / social_crawler named "Facebook" | Bot / social_crawler "WhatsApp" |
| Mixpanel | crawler pages (/import) | 2 page views, no bot label, channel Direct, counted as users | 1 page view, no label | 1 page view, no label | 6 page views, one user | not sent |
| Amplitude | crawler pages (HTTP V2) | 2 "Viewed /article Page", no label (Live Events) | 1 | 1 (geo US) | 6 | not sent |
| GA4 | crawler pages (Measurement Protocol, 204) | 1 session, 2 page views, device "smart tv", channel Unassigned, no bot label, counted as a user | 1 session, 1 page view, no label | 1 session, 1 page view, no label | 5 of 6 page views, one session | not sent |
| Plausible | crawler pages (Events API) | dropped (202 + x-plausible-dropped) | dropped | dropped | dropped | not sent |
| Umami | crawler pages (/api/send) | dropped (beep boop) | dropped | dropped | dropped | not sent |
| Pirsch | crawler pages (hit/batch, 200) | nothing appears | nothing | nothing | nothing | not sent |
| Cloudflare | sits in front (edge) | edge log "AI Assistant" (verified bot); AI Crawl Control chart 2 | edge: no category; AI Crawl Control chart 1 | no category | no category | status 499, no category |
| Fathom, Clarity, Mouseflow, LogRocket, Sentry | no server-side path* | – | – | – | – | – |
* Clarity's Bot Activity reads a CDN's logs (for Cloudflare, a Logpush job created from an API token). It is Cloudflare's data shown in Clarity, and Cloudflare was read directly, so it was not connected (decided 20 Nov).
- GA4 (read on 21 Nov, once 20 Nov was processed) shows no data for 20 Nov after 13:00 UTC, so the 14:24 repeat of the agent visit is not in it.
- Only three tools name the AI fetchers as AI fetchers: Privatrak
(AI assistants report, with the documented-only rule), Matomo (AI
Chatbots, for its seven names) and PostHog (query-time classification of
$http_log). Cloudflare labels ChatGPT-User only. - Gemini's bare
Googleuser agent is recognised by nobody as Gemini: PostHog calls it a regular visitor, Mixpanel, Amplitude and GA4 count it as a user, Privatrak keeps it as an unattributed crawler by design. - Mixpanel, Amplitude and GA4 count every fetch as a visitor's page view: 4 of Mixpanel's 7 "users" after 10:00 are fetchers.
- Apple's link preview names itself Facebook: its user agent carries
facebookexternalhit, so PostHog files it under Meta and Privatrak under the Facebook crawler pattern. - OAI-SearchBot fetched
robots.txta few seconds after ChatGPT-User: Privatrak counts 1 ChatGPT search crawler request, PostHog "OpenAI Search", Cloudflare "Search Engine Crawler".
The Claude in Chrome agent visit (JavaScript ran, real Chrome, DNT on)
No tool flagged it as automated or as an agent; nothing in the request said so.
| Recorded as a normal visitor | Not recorded |
|---|---|
| Plausible (Germany, 3 pages), Fathom (Brazil), Umami (Berlin), Pirsch (Germany), PostHog (Germany, channel Direct), Amplitude, Clarity, Mouseflow (live session), LogRocket (Berlin, "human-like"), Sentry (replay, Brazil), Cloudflare Web Analytics (Germany), GA4 (Germany, channel Direct, a returning user) | Mixpanel (honours DNT), Matomo (drops this VPN network; see below), Privatrak (that browser blocks it; the re-run: recorded, not flagged; see below) |
Privatrak missed the first run because of our own browser. The agent ran in the Chrome we work in, which blocks Privatrak's ingest so that we do not track ourselves. The API log has the tracker's settings request for each of the agent's three pages and no event request; a diagnostic page view in the same browser at 12:44 confirmed that only the ingest request failed, inside the browser. The visits Privatrak lost earlier (the Click Map visit, the stray visit, part of the manual round) were made in that browser too.
Re-run with the block off (14:24 UTC, /?via=claude-in-chrome-2, same
browser and path). Privatrak recorded it: 3 page
views and 2 clicks ("Pricing", "Contact"), none marked automated. Its
agent-pointer rule (in its open tracker source) judges a
click by the pointer move before it and never counts a page's first move as
evidence, because Chrome sends one indistinguishable move after every page
load. The agent clicked once per page, so each click's jump was that page's
first move and nothing was judged; the rule's own notes say "A page an agent
clicks once is not marked". So Privatrak, the one tool whose documentation
describes a rule for agents driving a real browser, did not flag this agent
either, as that documented limit predicts.
Matomo also lost the two page-weight visits from the same exit, although its script sent 12 and 14 requests in them. The exit was the same NordVPN network as the series' German VPN personas, and Matomo dropped 11 of the 13 NordVPN visits of the series too (section 10.5): Matomo Cloud discards visits from these VPN networks; the setting that does it is not visible to us.
The iPhone visits (in-app browsers send no referrer)
| Tool | Slack link via WhatsApp (Safari, declined) | ChatGPT app (accepted, utm_source=chatgpt.com) | iMessage (Safari, declined) |
|---|---|---|---|
| Privatrak | Direct, 6 page views | page view keeps utm_source; same visitor as the Slack visit (the API saw the same address and browser), whose first page view had no tag, so Direct by the first-page-view rule | Direct, a second visitor (the carrier gave another address) |
| Plausible | all three as ONE visit, 15 page views, Direct, utm "(not set)" | – merged – | – merged – |
| Fathom | one visitor, 17 page views with the phone filter; utm_source stripped from the page and in no report | – | – |
| Umami | one session, 2 visits, 15 views | UTM source chatgpt.com (1 view) | – |
| Pirsch | Direct, 6 views | referrer chatgpt.com, utm_source chatgpt.com; the iMessage visit merged into this session (9 views) | merged |
| Matomo | visit 134 = Slack + iMessage merged, 11 actions, direct | visit 135: channel "ai", ChatGPT | merged into 134 |
| PostHog | no browser events (opted out) | channel "AI" from utm_source, 4 page views | no browser events |
| Mixpanel | nothing (opted out) | utm_source chatgpt.com, channel "Other Advertising", 3 of 4 page views | nothing |
| Amplitude | nothing (opted out) | session with all events, Thailand | nothing |
| Clarity | each page its own session, twice (12 sessions for 6 pages) | 1 session, source chatgpt.com, channel "Other" | same split, 8 sessions, last /pricing missing |
| Mouseflow | Slack + iMessage as one session, 7 of 11 pages, tag "speed-browsing" | 3 of 4 pages, tag utm_source=chatgpt.com | merged |
| LogRocket | recorded in full (it has no consent call, so it was never told about the decline); same user as iMessage | /product missing; utm only in the URL | recorded |
| Sentry | not recorded (replay stopped) | replay, 3 page loads | not recorded |
| Cloudflare WA | direct | direct (query strings not readable on Free) | direct |
| GA4 | Slack + iMessage visits as one session, all 11 page views, Direct (recorded although consent was declined) | source chatgpt.com / ai-assistant, channel "AI Assistant", 3 of 4 page views | merged |
- Nobody attributes the WhatsApp, Slack or iMessage visits: no referrer, so Direct everywhere.
- The ChatGPT app's
utm_source=chatgpt.comis read five ways: AI channel (PostHog, Matomo, GA4), a referrer (Pirsch), a UTM source only (Umami, Clarity, Mouseflow), "Other Advertising" (Mixpanel), nothing (Fathom; Plausible and Privatrak because the visit merged into the earlier untagged one from the same phone). - Visits from one phone within 3 minutes merge in the cookieless tools (Plausible 1 visit, Umami 2, Pirsch 2 sessions, Matomo 2, Privatrak 2 visitors), and Clarity without consent splits every page into two sessions.
The page-weight runs (Playwright, webdriver: true)
Plausible and PostHog recorded nothing (their scripts stop on webdriver), Mouseflow nothing, Clarity nothing after 12:00; Matomo nothing (above). Privatrak stored all 6 page views marked automated. Mixpanel, Amplitude, Umami (one session for both runs), Fathom (one visitor, Brazil), Pirsch (one visitor, Germany), LogRocket, Sentry and GA4 (2 new users, 6 page views, Germany) counted them as people.
Sources: the MCP reads (Appendix H), the dashboards (read 12:20-12:45 UTC), and server-side-sends.jsonl.
11.5 What is still missing
- ChatGPT agent mode and Perplexity Computer/Comet's agent need paid plans; not run. Perplexity's search requested no page (one
/robots.txtonly), and Comet's search made no request to the site. - The phone round ran on Wi-Fi, not mobile data; the in-app findings do not depend on the network.
12. Product features beyond the counts
What each tool offers around its numbers, from each vendor's own pages, opened on 20 Nov 2026: plans, sharing, email reports, alerts, export, retention, sampling, limits, consent, hosting, bot filtering and server-side ingestion. Every cell is sourced; "not found in docs" means the listed pages do not say it. This chapter is documentation, not a test: where the lab measured the same thing (bot filtering, DNT, server-side paths), chapters 10 and 11 hold the measurement.
12.1 Plans compared
| Tool | Free plan / trial | Cheapest paid plan |
|---|---|---|
| Privatrak | Free forever: 10k events/mo, 1 project, 1 member | Starter $19/mo: 100k events, 3 projects, 5 members |
| GA4 | Standard property is free | GA4 360 (price not found in docs) |
| Plausible | No free plan; 30-day trial, no card | Starter $9/mo: 10k pageviews, 1 site |
| Fathom | No free plan; 7-day trial, card required | $15/mo: 100k pageviews, 50 sites |
| Umami Cloud | Hobby $0: 100K events/mo, 1 site, no team members | Pro $20/mo: 1M events, 20 sites, 10 members |
| Pirsch | No free plan; 30-day trial, no card | Standard $6/mo: 10k pageviews, 50 sites, unlimited members |
| Matomo Cloud | No free plan; 21-day trial, no card | Business from €29/mo: 50k hits, 30 sites, 30 users |
| Cloudflare Web Analytics | Free | No paid tier for Web Analytics; rules need Pro or higher |
| PostHog | Free: 1M events, 5K recordings, 1 project, unlimited members | Pay-as-you-go: same free tier, then usage; 6 projects |
| Mixpanel | Free: 1M events, 10K replays, unlimited seats | Growth: first 1M events free; 1.5M events $140/mo ($100 yearly) |
| Amplitude | Free: 2M events, 10K replays, unlimited seats | Plus: "starts at $0", first 2M events free, card required |
| Microsoft Clarity | Free forever, no traffic limits | None |
| Mouseflow | Free: 500 sessions/mo, 1 site, unlimited users | Essential 25/mo (annual; currency not shown): 5k sessions |
| Sentry | Developer: 5k errors, 50 replays, 1 user | Team $26/mo annual ($29 monthly): 50k errors, unlimited users |
| LogRocket | Free: 1,000 sessions/mo | Core $83/mo (annual) for 10k sessions |
12.2 Dashboard sharing
| Tool | Public link / password / read-only users |
|---|---|
| Privatrak | Project members only (Owner/Admin/Member); no public link or viewer role found |
| GA4 | Viewer role users; "copy link" (recipient access not stated); no public link found |
| Plausible | Shared links, optional password; Guest Viewer role. Shared links on Growth ($14) and up |
| Fathom | Private, passworded or public share URL; passworded viewers are view-only |
| Umami Cloud | Public read-only Share URL; password not found. Teams on Pro and up |
| Pirsch | Public dashboards, unique access links, view-only members; all on Standard |
| Matomo Cloud | Anonymous view access (public); view-only users; token_auth embeds |
| Cloudflare WA | Not found in docs |
| PostHog | Public link and embed; password protection only on Boost/Scale/Enterprise |
| Mixpanel | Public boards (Free: "Make Public" toggle); optional passcode; owner must enable |
| Amplitude | Public links on all plans (Free: limited allowance); optional password and expiry |
| Clarity | Share recordings/heatmaps with team or guests (guest links expire); Admin/Team member roles |
| Mouseflow | Session replays can be shared by link; no dashboard link found |
| Sentry | Public link per issue; dashboards are shared within the organisation only |
| LogRocket | Session URLs; public dashboard link not found in docs |
12.3 Scheduled email reports
| Tool | Finding |
|---|---|
| Privatrak | "Weekly summary" email every Monday (account setting) |
| GA4 | Admins only: daily/weekly/monthly/quarterly, PDF or CSV, up to 50 reports |
| Plausible | Weekly and/or monthly emails, plus Slack reports; on Starter |
| Fathom | Weekly or monthly, one or several sites, on every plan |
| Umami Cloud | Pro and up only; frequency not stated |
| Pirsch | Daily, weekly, every 2–3 weeks, or monthly; on Standard |
| Matomo Cloud | Scheduled email reports on all plans |
| Cloudflare WA | Not found in docs |
| PostHog | Email/Slack subscriptions: daily, weekly, monthly, custom; Free listed ("Up to 5" label unclear) |
| Mixpanel | Board subscriptions by email/Slack, daily/weekly/monthly; plan not stated |
| Amplitude | Dashboard subscriptions on all plans: HTML email plus CSV; PDFs to Slack |
| Clarity | Opt-in weekly "Clarity digest" email |
| Mouseflow | Not found in docs |
| Sentry | Weekly report email every Saturday |
| LogRocket | Issues and Errors digests by email, Slack, Teams or webhook |
12.4 Alerts / anomaly or traffic notifications
| Tool | Finding |
|---|---|
| Privatrak | Only usage emails at 80% and 100% of the event limit; no traffic alerts found |
| GA4 | Custom insights: threshold or "Has anomaly", optional email; 50 per property |
| Plausible | Traffic spike and drop email alerts with your own threshold; plan not stated |
| Fathom | Not found in docs |
| Umami Cloud | Not found (the notifications page covers product emails only) |
| Pirsch | Traffic spike notifications and no-traffic warnings; on Standard |
| Matomo Cloud | Custom alerts on all plans |
| Cloudflare WA | Not found in docs |
| PostHog | Threshold or anomaly alerts; Free up to 5, paid unlimited |
| Mixpanel | Paid only: Growth 5 per project; anomaly detection Enterprise only |
| Amplitude | Docs: all plans, Free 1 alert, Plus 2. Pricing page says Free "not included" |
| Clarity | "Drop in traffic" email when page views fall more than 50% week on week |
| Mouseflow | Pricing lists "real-time alerts" (Free too); help: JS-error notifications, daily or hourly |
| Sentry | Free: email alerts only. Paid: integrations and more alert types |
| LogRocket | Timeseries alerts (threshold or anomaly) by email, Slack, PagerDuty, webhook; up to 100 |
12.5 Data export and API
| Tool | CSV/UI export · raw export · API (free?) |
|---|---|
| Privatrak | CSV export not found; REST API and MCP via API keys (2 keys on Free) |
| GA4 | CSV/PDF/Sheets up to 100k rows; free BigQuery raw export (1M events/day batch); free Data API with quotas |
| Plausible | CSV needs an active trial or subscription; Stats API Business only; raw export Enterprise |
| Fathom | CSV downloads; Analytics API on all plans (each API call counts as a pageview) |
| Umami Cloud | Gzipped CSV export on Hobby; API only on Pro and up |
| Pirsch | CSV export and REST API on Standard; raw data Enterprise or via support |
| Matomo Cloud | Exportable widgets; HTTP API on all plans; raw export via API |
| Cloudflare WA | GraphQL API; CSV export not found |
| PostHog | API for all users; batch exports free for the first 1M rows/mo |
| Mixpanel | Free: CSV/PNG/PDF up to 10k rows; Query API Growth and up; raw export API plan not stated |
| Amplitude | Export API "on all plans" (docs); pricing says exports Growth/Enterprise only |
| Clarity | Downloads; Data Export API: 10 requests/day, last 1–3 days, 1k rows |
| Mouseflow | Pricing: no export or API on Free/Essential; help describes CSV downloads |
| Sentry | Free: no API access (pricing); Discover CSV export (plan unclear) |
| LogRocket | HAR and console logs per session; API/MCP on Core; streaming export Enterprise |
12.6 Data retention
| Tool | Finding |
|---|---|
| Privatrak | Free 30 days, Starter 90, Pro 180; Flows at most 90 days |
| GA4 | Event- and user-level 2 or 14 months (explorations and funnels only); standard reports unaffected |
| Plausible | "No retention limit" (Starter) |
| Fathom | "Ongoing data retention" while subscribed; no period stated |
| Umami Cloud | Hobby 6 months, Pro 2 years, Business 5 years |
| Pirsch | Unlimited on all plans |
| Matomo Cloud | Raw data 24 months; reports kept indefinitely |
| Cloudflare WA | Unsampled 7 days, then about 10% aggregate; 6 months viewable |
| PostHog | Events: Free 1 year, paid 2 years. Replays: Free 30 days, paid 90 |
| Mixpanel | Data default 2 years; replays 30 days |
| Amplitude | Free 1 year data access; Plus 2 years |
| Clarity | Recordings 30 days (favourites and a sample up to 9 months); heatmaps 9 months |
| Mouseflow | Free 1 month, Essential 3, Advanced 6, Premium 12 |
| Sentry | Free 30-day lookback; Team up to 90 days |
| LogRocket | Not found in docs (set by plan; extended retention on Pro/Enterprise up to 12 months) |
12.7 Sampling
| Tool | Finding |
|---|---|
| Privatrak | Not found in docs |
| GA4 | Explorations sample above 10M events per query; thresholds withhold rows and cannot be adjusted |
| Plausible | Not found in docs |
| Fathom | "We do not use probabilistic or approximate counting methods" |
| Umami Cloud | Not found in docs |
| Pirsch | Not found in docs |
| Matomo Cloud | "Matomo does not sample data" |
| Cloudflare WA | Dynamic sampling between 0.0001% and 100% per query |
| PostHog | Replay sample rate is configurable (100% recommended); insight sampling not found in docs |
| Mixpanel | Query-time sampling only on Enterprise above 2B events/mo; web replay default 0% |
| Amplitude | Opt-in query-time sampling (10% of users); replay sampleRate default 0 |
| Clarity | Records up to 100k sessions/project/day; heatmaps use a sample, max 100k pageviews; FAQ claims "no sampling" |
| Mouseflow | Recording rate: Free/Essential 100%, Advanced 75%, Premium 50%; pauses at monthly cap |
| Sentry | Replay session sample rate (0.1 recommended default; 1.0 on error) |
| LogRocket | Records until the session quota; Conditional Recording add-on (Pro/Enterprise) |
12.8 Free-plan limits
| Tool | Finding |
|---|---|
| Privatrak | 10k events/mo, 1 project, 1 member, 1 dashboard, 3 funnels, 2 API keys |
| GA4 | No monthly event cap found; configuration limits (e.g. 50 event-scoped dimensions, 30 key events) |
| Plausible | No free plan (30-day trial) |
| Fathom | No free plan (7-day trial) |
| Umami Cloud | 100K events/mo, 1 website, no team members |
| Pirsch | No free plan (30-day trial) |
| Matomo Cloud | No free plan (21-day trial) |
| Cloudflare WA | 10 non-proxied sites (soft limit); proxied sites unlimited |
| PostHog | 1M events, 5K recordings, 1M flag requests, 1 project, unlimited members |
| Mixpanel | 1M events/mo, 10K replays, unlimited seats and saved reports |
| Amplitude | 2M events, 10K replays/mo, unlimited seats |
| Clarity | No traffic limits; unlimited projects and members; 100k recorded sessions/day |
| Mouseflow | 500 sessions/mo, 1 website, unlimited users |
| Sentry | 5k errors, 50 replays, 5M spans, 1 user, 10 dashboards |
| LogRocket | 1,000 sessions/mo |
12.9 Cookie / consent stance (as the vendor states it)
| Tool | Finding |
|---|---|
| Privatrak | No cookies, stores nothing on device; "in many countries you need no banner" |
| GA4 | Uses cookies; Consent Mode (basic/advanced) sends cookieless pings when consent is denied |
| Plausible | No cookies; "you do not need cookie banners" |
| Fathom | No cookies; no consent banner needed |
| Umami Cloud | Tracker uses no cookies; GDPR "depends on how you configure" it |
| Pirsch | "We do not use cookies"; banner not covered |
| Matomo Cloud | Cookies can be disabled; banner-free only under conditions (e.g. CNIL); German JS tracking needs consent |
| Cloudflare WA | No cookies or localStorage, no fingerprinting; consent not addressed |
| PostHog | Cookies by default; cookieless_mode: "always" needs no banner |
| Mixpanel | Cookie/localStorage; customer responsible for consent; opt-out API |
| Amplitude | Browser SDK sets cookies on init; identityStorage: none; customer obtains consent |
| Clarity | First-party cookies; explicit consent required in EEA/UK/CH via the Consent API |
| Mouseflow | Cookies, or a "Disable Cookies" app that uses local/sessionStorage; consent still the customer's duty |
| Sentry | Not found in docs (docs only cover capturing cookie data) |
| LogRocket | _lr_tabs_ and _lr_hb_ cookies, which "cannot be disabled"; consent not covered |
12.10 Where data is stored / EU option
| Tool | Finding |
|---|---|
| Privatrak | "Servers in the EU" (country not named) |
| GA4 | Google data centres, no region named; no EU-only option found |
| Plausible | EU, on infrastructure owned by European companies |
| Fathom | EU visitors processed in the EU, others in the US; "Extreme EU isolation" option |
| Umami Cloud | US or EU region, chosen at signup |
| Pirsch | Cloud in Germany |
| Matomo Cloud | Frankfurt, Germany |
| Cloudflare WA | Processed at the nearest data centre; option to exclude EEA/UK/CH visitors |
| PostHog | US (Virginia) or EU (Frankfurt) |
| Mixpanel | EU data residency available on Free and Growth |
| Amplitude | US or EU data centre (EU included on Free) |
| Clarity | Microsoft Azure; EU customers contract with Microsoft Ireland; region not named |
| Mouseflow | EU-based customers in the EU; Americas and Oceania in the US |
| Sentry | US (Iowa) or EU (Frankfurt), chosen when the organisation is created |
| LogRocket | SaaS hosted in the US; self-hosting on Enterprise |
12.11 Bot filtering
| Tool | Finding |
|---|---|
| Privatrak | Crawlers left out automatically and not billed; automated visits marked and filterable |
| GA4 | Known bots excluded automatically; cannot be disabled; excluded volume not shown |
| Plausible | Automatic (UA, referrer spam, ~40,800 data-centre ranges, automation); Shields for custom rules |
| Fathom | Automatic (UA, data-centre IPs, missing UA); can be disabled; blocked count shown |
| Umami Cloud | Self-host docs: bots excluded by default; not stated for Cloud |
| Pirsch | Blocks most data-centre IPs and drops suspected bots; custom IP/path/country filters |
| Matomo Cloud | Bots excluded by default (Device Detector); custom UA exclusions; spam prevention |
| Cloudflare WA | "Exclude Bots" filter in reports; default not stated |
| PostHog | JS SDK blocks known bots (including Playwright etc.); "Is bot" filter; custom rules |
| Mixpanel | JS library drops 5 named crawlers by default; $ignore property for the rest |
| Amplitude | IAB/ABC bot list blocked by default for Browser SDK 1.10+; block filters |
| Clarity | Bot detection on by default; can be turned off; excluded count shown |
| Mouseflow | Optional Basic Bot Filtering (waits for an interaction); default not stated |
| Sentry | Inbound filter for errors from web crawlers; default not stated |
| LogRocket | Not found in docs |
12.12 Server-side / log-based ingestion (crawlers, AI fetchers)
| Tool | Finding |
|---|---|
| Privatrak | Server requests via WordPress, Cloudflare Worker, Next.js, Nuxt, Node or HTTP API; not billed |
| GA4 | Measurement Protocol adds to tagging; it does not replace it |
| Plausible | Events API needs the visitor's UA and IP; data-centre IPs are dropped |
| Fathom | Not found in docs |
| Umami Cloud | /api/send, /api/batch and @umami/node; valid User-Agent required |
| Pirsch | Server-side hit API (visitor IP, URL, UA); suspected bots dropped |
| Matomo Cloud | Log Analytics importer works with Cloud; AI chatbots via CloudFront, Cloudflare, WordPress |
| Cloudflare WA | Edge collection for proxied sites (DNS change, no code) |
| PostHog | Server or CDN logs as $http_log events (Vercel source, Cloudflare Worker, capture API) |
| Mixpanel | HTTP API and SDKs; forward the raw UA so AI agents and bots are classified |
| Amplitude | HTTP and Batch API with a user_agent field for bot blocking |
| Clarity | Bot Activity from CDN logs (Cloudflare, Fastly, CloudFront, Akamai, Azure Front Door, WordPress) |
| Mouseflow | Not found in docs |
| Sentry | Server SDKs for errors only; crawler ingestion not found |
| LogRocket | Not found in docs (MCP Replay records MCP server requests only) |
12.13 Where vendor pages disagree
- Amplitude: the pricing page says Free has no alerts and that exports are Growth/Enterprise only. The docs say alerts exist on all plans (Free gets 1) and that the Export API is on all plans.
- Mouseflow: the pricing page says Free and Essential have no data export or REST API. A help article describes CSV downloads without naming a plan.
- PostHog: the subscriptions page shows "Up to 5" next to a list of plans that includes Free, but does not say which plans the limit covers.
12.14 Sources
All opened 2026-11-20.
Privatrak
- https://privatrak.com/pricing
- https://privatrak.com/llms.txt
- https://privatrak.com/docs/plans
- https://privatrak.com/docs/custom-dashboards
- https://privatrak.com/docs/privacy
- https://privatrak.com/docs/members
- https://privatrak.com/docs/server-requests
- https://privatrak.com/docs/settings
- https://privatrak.com/docs/sessions
- https://privatrak.com/docs/events
- https://privatrak.com/docs/ai-services
- https://privatrak.com/docs/mcp-reference
Google Analytics 4
- https://support.google.com/analytics/answer/7667196
- https://support.google.com/analytics/answer/13331292
- https://support.google.com/analytics/answer/9888366
- https://support.google.com/analytics/answer/9383630
- https://support.google.com/analytics/answer/13722168
- https://support.google.com/analytics/answer/9317657
- https://support.google.com/analytics/answer/9443595
- https://support.google.com/analytics/answer/9358801
- https://support.google.com/analytics/answer/12229528
- https://support.google.com/analytics/answer/10000067
- https://support.google.com/analytics/answer/6004245
- https://developers.google.com/analytics/devguides/collection/protocol/ga4
- https://developers.google.com/analytics/devguides/reporting/data/v1/quotas
Plausible
- https://plausible.io/#pricing
- https://plausible.io/docs/shared-links
- https://plausible.io/docs/email-reports
- https://plausible.io/docs/traffic-spikes
- https://plausible.io/docs/export-stats
- https://plausible.io/docs/stats-api
- https://plausible.io/docs/events-api
- https://plausible.io/docs/users-roles
- https://plausible.io/docs/bot-traffic-filtering
- https://plausible.io/data-policy
Fathom
- https://usefathom.com/pricing
- https://usefathom.com/features
- https://usefathom.com/docs/features/shared-dashboards
- https://usefathom.com/docs/start/measurement
- https://usefathom.com/docs/features/bot-detection
- https://usefathom.com/docs/script/eu-isolation
- https://usefathom.com/docs/troubleshooting/cookies
- https://usefathom.com/data
- https://usefathom.com/api
Umami Cloud
- https://umami.is/pricing
- https://docs.umami.is/docs/cloud
- https://docs.umami.is/docs/cloud/faq
- https://docs.umami.is/docs/cloud/notifications
- https://docs.umami.is/docs/cloud/email-reports
- https://docs.umami.is/docs/cloud/export-data
- https://docs.umami.is/docs/enable-share-url
- https://docs.umami.is/docs/faq
- https://docs.umami.is/docs/environment-variables
- https://docs.umami.is/docs/guides/send-server-side-events
Pirsch
- https://pirsch.io/pricing (the comparison table was read from the raw HTML)
- https://docs.pirsch.io/
- https://docs.pirsch.io/advanced/access
- https://docs.pirsch.io/advanced/email-reports
- https://docs.pirsch.io/advanced/traffic-alerts
- https://docs.pirsch.io/advanced/traffic-spike
- https://docs.pirsch.io/advanced/traffic-filter
- https://docs.pirsch.io/get-started/export
- https://docs.pirsch.io/get-started/backend-integration
- https://docs.pirsch.io/privacy
- https://docs.pirsch.io/faq
Matomo Cloud
- https://matomo.org/pricing/
- https://matomo.org/start-free-analytics-trial/
- https://matomo.org/faq/general/configure-data-retention/
- https://matomo.org/faq/troubleshooting/faq_50/
- https://matomo.org/faq/new-to-piwik/faq_63/
- https://matomo.org/faq/how-to/faq_20130/
- https://matomo.org/faq/new-to-piwik/how-do-i-use-matomo-analytics-without-consent-or-cookie-banner/
- https://matomo.org/faq/general/can-i-use-log-analytics-with-matomo-cloud/
- https://matomo.org/faq/reports/what-are-ai-assistants-in-matomo/
Cloudflare Web Analytics
- https://developers.cloudflare.com/web-analytics/faq/
- https://developers.cloudflare.com/web-analytics/limits/
- https://developers.cloudflare.com/web-analytics/about/
- https://developers.cloudflare.com/web-analytics/data-metrics/data-origin-and-collection/
- https://developers.cloudflare.com/web-analytics/data-metrics/dimensions/
- https://developers.cloudflare.com/analytics/faq/about-analytics/
- https://developers.cloudflare.com/speed/observatory/rum-beacon/
- https://www.cloudflare.com/web-analytics/
PostHog
- https://posthog.com/pricing (raw HTML)
- https://posthog.com/pricing.md
- https://posthog.com/data-pipelines/pricing
- https://posthog.com/llms.txt
- https://posthog.com/docs/product-analytics/sharing
- https://posthog.com/docs/product-analytics/subscriptions
- https://posthog.com/docs/alerts
- https://posthog.com/docs/session-replay/recording-retention
- https://posthog.com/docs/session-replay/how-to-control-which-sessions-you-record
- https://posthog.com/docs/product-analytics/sampling
- https://posthog.com/docs/how-posthog-works/queries
- https://posthog.com/docs/api
- https://posthog.com/docs/privacy/data-collection
- https://posthog.com/tutorials/cookieless-tracking
- https://posthog.com/docs/web-analytics/managing-bot-traffic
- https://posthog.com/docs/web-analytics/bot-detection
Mixpanel
- https://mixpanel.com/pricing/
- https://docs.mixpanel.com/docs/pricing
- https://docs.mixpanel.com/docs/boards
- https://docs.mixpanel.com/docs/boards/public-boards
- https://docs.mixpanel.com/docs/features/alerts
- https://docs.mixpanel.com/docs/export-methods
- https://docs.mixpanel.com/docs/reports
- https://docs.mixpanel.com/docs/tracking-best-practices/bot-traffic
- https://docs.mixpanel.com/docs/tracking-best-practices/server-side-best-practices
- https://docs.mixpanel.com/docs/privacy/protecting-user-data
Amplitude
- https://amplitude.com/pricing
- https://amplitude.com/docs/analytics/share-external
- https://amplitude.com/docs/analytics/dashboard-subscribe
- https://amplitude.com/docs/analytics/insights
- https://amplitude.com/docs/analytics/charts/optimize-query-performance
- https://amplitude.com/docs/apis/analytics/export
- https://amplitude.com/docs/data/destination-catalog/amazon-s3
- https://amplitude.com/docs/data/block-bot-traffic
- https://amplitude.com/docs/data/privacy-and-consent-implementation
Microsoft Clarity
- https://learn.microsoft.com/en-us/clarity/faq
- https://learn.microsoft.com/en-us/clarity/setup-and-installation/clarity-setup
- https://learn.microsoft.com/en-us/clarity/setup-and-installation/clarity-data-export-api
- https://learn.microsoft.com/en-us/clarity/setup-and-installation/clarity-downloads
- https://learn.microsoft.com/en-us/clarity/ai-visibility/bot-activity-overview
Mouseflow
- https://mouseflow.com/pricing/
- https://mouseflow.com/legal/gdpr/
- https://mouseflow.com/legal/subprocessors/
- https://help.mouseflow.com/en/articles/4271081-basic-bot-filtering
- https://help.mouseflow.com/en/articles/4277755-recording-controls
- https://help.mouseflow.com/en/articles/4270325-how-can-i-export-mouseflow-data
- https://help.mouseflow.com/en/articles/4277814-setting-a-monthly-recording-limit
- https://help.mouseflow.com/en/articles/4397887-how-long-is-data-stored
- https://help.mouseflow.com/en/articles/9112429-session-replay-recorded-sessions-and-live-sessions
- https://help.mouseflow.com/en/articles/5167255-disable-cookies
Sentry
- https://sentry.io/pricing/
- https://docs.sentry.io/organization/data-storage-location/
- https://docs.sentry.io/concepts/data-management/filtering/
- https://docs.sentry.io/platforms/javascript/data-management/data-collected/
- https://docs.sentry.io/product/explore/discover-queries/query-builder/
- https://docs.sentry.io/product/issues/issue-details/
- https://docs.sentry.io/product/notifications/
- The replay sample rates (0.1, and 1.0 on error) are from a search summary of https://docs.sentry.io/platforms/javascript/session-replay/. I did not open that page, so this one figure is unverified.
LogRocket
- https://logrocket.com/pricing (also raw HTML)
- https://docs.logrocket.com/llms.txt
- https://docs.logrocket.com/docs/q-a
- https://docs.logrocket.com/docs/your-plans-page
- https://docs.logrocket.com/reference/cookies
- https://docs.logrocket.com/docs/dashboards
- https://docs.logrocket.com/docs/metrics-alerting
13. Tool profiles
Each profile has the same parts:
- Delivered: what the tool received on 17-18 Nov.
- All days, AI and apps: what chapters 10 and 11 added.
- Dashboard and MCP: what each test showed.
- Strengths and gaps, as the lab saw them. A strength is a measured result where the tool did better than most or saved effort; a gap is what cost an answer or could mislead a reader. The same rules apply to every tool; deliberate choices are under By design.
Steps count the setup screens from chapter 6.
13.1 Privatrak (ours)
- Type: cookieless product analytics. Visitors are a daily-key hash of IP and user agent; no geodata.
- Plan: ours. Setup takes 2 steps to the snippet since 15 Nov (6 when the lab was set up on 14 Nov; chapter 6).
- Delivered: 102 visits, 71 person-days, 199 page views. It was the most complete delivery of any tool, and its script is on no block list yet.
- Dashboard: 7 ✓, mean findability 4.3.
- Visitors, sources, the funnel, features (downloads, outbound, purchases) and click problems are all on the Overview, or one click away.
- MCP: official, hosted, OAuth.
- 7 ✓, 18 calls with none failed, 57 s.
- Same numbers with Sonnet and Opus (as Plausible, Pirsch, Matomo and Cloudflare).
- Setup worked, inside a setup run with undo (dry run, then all 4 objects removed).
- Its round-2 report named the two broken controls with every number found, missed the 404, and reported a TypeError that is likely its own false positive. It stored the report as an AI review.
- It has the second-largest tool context (~60,000 tokens).
- All days, AI and apps (chapters 10, 11): no recognition across days (daily key, as documented); the AI assistants report named ChatGPT (2) and Claude (1) fetches from the server-side feed and kept Gemini's
Googleunattributed; automated page-weight runs stored and marked. It recorded the Claude in Chrome agent unflagged (the first run went through our own browser, which blocks Privatrak; the re-run without that block): its agent-pointer rule needs two clicks on one page, the agent clicked once per page. Stored nothing in the browser. - Strengths:
- The most complete delivery: 102 of 104 visits (its script was on no block list yet).
- Visitors and page views exact: 72 and 200, checked event by event against the records (chapter 5).
- The only answer with both rage and dead click counts exact ("Duplicate form" 7 / 4, named by text).
- Most answers on one screen, the Overview.
- Automated visits kept and marked rather than dropped.
- Through MCP: 7 ✓ with no failed call, the same numbers with two models, and revenue right (one of four servers).
- Setup through MCP with undo, the only server that can undo.
- Names AI assistants' fetches from a server-side feed (one of three tools).
- Nothing stored in the visitor's browser.
- Gaps:
- Revenue only through an Insights sum, without a currency.
- Nothing marks a 404, and its MCP report missed the broken link.
- Error clicks may include other scripts' cancelled requests: its "Place order" error clicks are likely false positives (14.2, item 10).
- Its agent rule misses an agent that clicks once per page.
- Its MCP server has no crawler or link-preview view.
- By design: no location data, so no country reports; visitors are not recognised across days (a daily key); time on page is active time (visible tab, recent input).
13.2 Plausible
- Type: cookieless web analytics, daily salt.
- Plan: 30-day trial (Business features). Setup took 1 step.
- Delivered: 39 visits, 26 person-days. It dropped every Playwright-Chromium visit (202 +
x-plausible-dropped); a real Chrome was kept. - Dashboard: 8 ✓, mean findability 4.7.
- One page of tabbed boxes; goals for downloads, outbound clicks, forms and 404 are created automatically.
- Revenue (€24) and an ordered funnel are shown plainly.
- MCP: community server by Sentry, Stats API key.
- 7 ✓, 43 s, the fastest.
- No funnels, no goal list, no writes.
- Every revenue call failed on the server's output schema.
- All days, AI and apps: page views exact on every r4 day once real browsers are counted; a range's visitors are the sum of its days. Dropped every server-side crawler page view (202,
x-plausible-dropped) and the webdriver page-weight runs; merged three phone visits within 3 minutes into one visit and lost the ChatGPT app'sutm_source. - Strengths:
- Page views exact or within one on every day, for the visits it kept.
- Most answers on the first screen (findability 4.7); revenue (€24) and an ordered funnel shown plainly.
- Downloads, outbound clicks, form submissions and 404s detected without setup.
- The fastest MCP answers (43 s).
- The smallest script (3 KB), and nothing stored in the browser.
- Time on page close to the wall-clock time (66 s against 79 s).
- Gaps:
- Silent dropping of automated browsers and many VPN and data-centre visits: the dashboard and API never say what was discarded.
- The MCP server is unofficial and cannot do revenue.
- Three phone visits within 3 minutes merged into one, losing the ChatGPT app's
utm_source. - Its round-2 report read the smaller day 2 as "engagement collapsed".
- By design: visitors are not recognised across days (a daily salt); no click problems or replays.
13.3 Pirsch
- Type: cookieless web analytics.
- Plan: 30-day trial. Setup took 2 steps.
- Delivered: 99 visits, 68 person-days.
- Dashboard: 6 ✓, findability 4.3.
- Referrers, countries and events are all on the dashboard.
- Downloads, outbound clicks and 404s arrive on their own.
- The UI funnel works (23 → 4 → 4).
- MCP: community server, OAuth client.
- 6 ✓, the smallest context (~2,000 tokens).
- Takes
timezone=UTC.
- All days, AI and apps: 20 Nov exact; no recognition across days; nothing from the server-side crawler feed appears. Read the ChatGPT app's
utm_sourceas referrer chatgpt.com; kept a URL fragment (#st-picker) as a page. - Strengths:
- 20 Nov exact.
- Downloads, outbound clicks and 404s arrive on their own.
- The smallest MCP context (~2,000 tokens), and UTC days through
timezone=UTC. - Revenue through MCP (one of four servers, without a currency).
- A 4 KB script, and nothing stored in the browser.
- Gaps:
- The UI shows only the domain's zone, so UTC days are impossible. The timezone select is misleading.
- Time on page is badly inflated: 18 min 16 s on
/article, and the same in the API. - Revenue only as metadata.
- The server's
funnelsmetric fails. - "Google" and "google" appear as separate rows, and a URL fragment was kept as a page.
- By design: visitors are not recognised across days (the date is part of the hash).
13.4 Umami Cloud
- Type: cookieless web analytics; monthly salt by default.
- Plan: free (Hobby). Setup took 1 step.
- Delivered: 83 visits, 66 person-days. It was missing 13 of the first 15 visits of 17 Nov, during its own HTTP 500 outage.
- Dashboard: 6 ✓, findability 4.3.
- Sources were exact.
- Funnels Contact (22 → 3 → 3) and Checkout.
- Revenue €56 exact, with per-referrer and per-country revenue.
- MCP: official since September 2026, but only from Pro; not tested.
- All days, AI and apps: 20 Nov exact; merged the phone's three visits into one session; answered every server-side crawler post
beep boop(bot) and showed none; UTM source chatgpt.com kept. - Strengths:
- 20 Nov exact, and exact sources.
- Revenue €56 exact, with revenue per referrer and per country.
- Funnels that work (Contact 22 → 3 → 3).
- An 8 KB script, and nothing stored in the browser.
- Gaps:
- The start page and settings show a login form even when you are signed in.
- The URL holds the browser's midnights, so an edited URL is off by the browser's offset.
- Revenue opens in USD as "$0.00".
- "Visit duration" 0 s stands in for time on page.
- By design: a monthly salt by default; on the free plan no downloads, outbound clicks, 404 marking or click problems.
13.5 Fathom
- Type: cookieless web analytics, daily salt at midnight UTC.
- Plan: trial. Setup took 1 step.
- Delivered: 99 visits, 68 person-days.
- Dashboard: 3 ✓, findability 4.8 over the five questions it could answer.
- Everything on one page: visitors, referrers, countries, events, revenue (€56 exact) and the 404 event.
- MCP: only a community server with three tools (account, sites, current visitors), which cannot answer analytics questions.
- All days, AI and apps: visitors exact on every day once the extras count; places NordVPN's PacketHub exits in Brazil; dropped
utm_sourcefrom the page and showed it nowhere; no server-side path. - Strengths:
- The highest findability (4.8) where it answers.
- Visitors exact on every day once the extras count; revenue and 404 exact.
- A 5 KB script, and nothing stored in the browser.
- Gaps:
- 20 page views short on 17-18 Nov (unexplained).
- Brazil 20 for visits from VPN, data-centre and some residential exits.
- UTM campaigns not shown.
- The 7-day view lagged behind "Today".
- By design: no time on page and no funnels; downloads, outbound clicks and 404s only as events the site sends; visitors are not recognised across days (a daily salt).
13.6 Google Analytics 4
- Type: web analytics, cookies.
- Plan: free. Setup took 7 steps, with pre-ticked data-sharing options and a GDPR DPA checkbox.
- Delivered: 92 visits; two proxy exits could not load gtag.js.
- Dashboard: all ≈, because the property was on Los Angeles time and no report can show UTC days. Against its own window the numbers are close.
- Funnels exist only as explorations, about 30 clicks to build.
- Revenue is converted to USD silently ($26.44 for €24).
- Two user counts on neighbouring screens.
- MCP: official, local. 11 setup steps and about 25 minutes, including a blocked sign-in and an API the guide doesn't name.
- Round 1 answered in the property's days.
- Opus rebuilt UTC days from
dateHour: 49 users, 179 page views. - Write tools need
--allow-write.
- All days, AI and apps: read per window on its Los Angeles days; recognises returning users. Counted the AI fetches sent through the Measurement Protocol as ordinary users (ChatGPT's as a "smart tv"), the ChatGPT app's visit under its "AI Assistant" channel, the agent as a returning user, and the webdriver page-weight runs as 2 new users.
- Strengths:
- Downloads and outbound clicks captured by default.
- Recognises returning users.
- Its typed report tool let the Opus run rebuild exact UTC days.
- Gaps:
- The timezone trap: days follow the property's zone and cannot be read in UTC.
- Numbers for a finished day change a day later.
- Revenue converted to USD silently.
- Two user counts on neighbouring screens; time per user, not per view.
- Heavy setup, both for the tool and for MCP.
- By design: cookies and consent; no rage or dead clicks.
13.7 Matomo Cloud
- Type: web analytics, cookies (
_pk_id, 13 months). - Plan: 21-day trial. Setup took 3+ steps; dense admin.
- Delivered: 78 visits. It counted 49.
- Dashboard: mostly ≈ (1 ✓), findability 4.2.
- Channels including AI Assistants, ecommerce, goals and funnels are all there.
- Unique visitors are not offered for a date range.
- MCP: official, hosted, off by default (superuser setting plus an auth token).
- Numbers identical to the UI.
- Setup only through the raw
Goals.addGoalcall. - The API cannot add widgets to a dashboard.
- All days, AI and apps: recognised every returning persona on 19 and 20 Nov exactly. Its 49 of 78 comes from the 30-minute visit merge and from dropping NordVPN visits (11 of 13, and the VPN visits on 20 Nov). The AI Chatbots report named the ChatGPT (2) and Claude (1) fetches from the server-side feed; day reports lagged.
- Strengths:
- Recognised every returning visitor on the last two days, exactly.
- Its AI Chatbots report named the ChatGPT and Claude fetches.
- The fullest classic web-analytics feature set (ecommerce, goals, heatmaps, recordings).
- Identical numbers in UI and API, and with two models.
- Gaps:
- The undercount: visits from most VPN exits silently dropped (the setting behind it not identified).
- Time on page 235 s.
- Direct is no row through the API.
- By design: cookies and consent; a 30-minute visit; query strings kept as separate pages by default.
13.8 PostHog
- Type: product analytics, cookie plus local storage.
- Plan: free. Setup took 4 steps, with heatmaps, dead clicks and replay on three different settings pages.
- Delivered: 66 visits (consent-gated).
- Dashboard: 6 ✓, findability 3.3.
- Web analytics is a real overview, but its headline tiles (39 visitors, 76 page views) disagree with its own tables (41, 106).
- Time on page, PDF clicks and revenue only through trends insights.
- MCP: official, hosted.
- One
execgateway to ~640 sub-commands, with HogQL. - 7 ✓; answered everything, mostly in SQL.
- Setup worked (insight, action, dashboard), with no undo. Its write tools include deleting persons and changing project settings.
- Its round-2 report found all three site defects and its own measurement gaps.
- One
- All days, AI and apps: recorded none of the app page's
pushStateroutes; its script mostly stops on webdriver. From$http_logit classified ChatGPT-User and Claude-User as AI agents, WhatsApp as a social crawler, Apple's preview as "Facebook", and Gemini'sGoogleas a regular visitor. Gave the ChatGPT app visit channel "AI". - Strengths:
- Answered all ten questions through MCP.
- Classified AI fetchers from server logs (
$http_log). - Its MCP report found all three site defects.
- Real funnels, and SQL over everything.
- Gave the ChatGPT app's visit the channel "AI".
- Gaps:
- Contradictory numbers on one screen.
- No
pushStateroutes recorded with the default setup. - Property names must be known (
revenue, nottotal). - The base currency defaults to USD.
- By design: cookies and consent; its script mostly stops on
navigator.webdriver.
13.9 Mixpanel
- Type: product analytics, cookies.
- Plan: free. Setup took 2 steps; EU residency needs
api_hostset in the code. - Delivered: 69 visits (consent-gated).
- Dashboard: 6 ✓, findability 3.1.
- No traffic overview: every answer is an Insights report (6-10 clicks).
- The home page claims no users or events.
- Dead clicks only by element ID (
b).
- MCP: official, hosted, EU URL.
- 7 ✓ but slow (6.6 minutes): hand-built report JSON.
- The largest tool context (~64,000 tokens).
- Setup only onto a board. Mixpanel has no goal object, and saving a cohort was refused on the free plan.
- All days, AI and apps: honours Do Not Track (dropped the DNT agent visit and the DNT+GPC personas); counted every server-side crawler page view as a user's page view without a bot label; channel "Other Advertising" for
utm_source=chatgpt.com. - Strengths:
- Exact counts once the report is built; revenue correct in the dashboard and through MCP.
- 7 ✓ through MCP.
- Rage and dead clicks per element (by id).
- Gaps:
- No source property: the site itself is the top referrer.
- The home page claims no users or events while data arrives.
- Saved query definitions can't be read back through MCP.
- By design: cookies and consent; honours Do Not Track; no time on page.
13.10 Amplitude
- Type: product analytics.
- Plan: free Starter. Setup took 1 step, with a live-configuring snippet.
- Delivered: 82 visits (consent-gated; 13 decliners' requests cancelled).
- Dashboard: 2 ✓, findability 2.6, the lowest.
- A ready Marketing Analytics web dashboard exists, but sources, countries and clicks need new charts.
- Charts have no total column.
- Time Spent Per Page 18 min 45 s.
- Dead clicks by text, no rage event.
- Revenue correct after a property default that gives 0.
- MCP: only on Enterprise or the Plus add-on; not tested.
- All days, AI and apps: recognises visitors across days (42 for 41 personas); ingested every server-side crawler page view without a label; opted out on the stored consent decline.
- Strengths:
- Recognised visitors across days (42 for 41 personas).
- Dead clicks named by element text.
- A snippet that configures itself live.
- Gaps:
- Inflated time on page (18 min 45 s).
- Charts have no total column.
- Answers are charts to build (findability 2.6).
- By design: cookies and consent.
13.11 Microsoft Clarity
- Type: session replay and heatmaps.
- Plan: free. Setup took 1 step; smart events are detected automatically.
- Delivered: 84 visits.
- Dashboard: all ≈ or ✗, findability 3.6.
- 112 sessions for 84 visits, with 46 bot sessions excluded.
- France 25 against 14.
- The site itself is the top referrer.
- Time only per session.
- The heatmap ranks text and a chart as dead clicks but not the real dead button.
- MCP: official, local; sign-in in the browser (twice); last 1-3 days only; 10 calls a day. It answered in round 2: 112 sessions, France 29.
- All days, AI and apps: recognises almost nobody (148 users for 40 personas): its cookie waits for consent; without consent it cuts every page into separate sessions, each listed twice. Honours GPC, not DNT alone. Its Bot Activity (a CDN's logs) was not connected: Cloudflare was read directly.
- Strengths:
- Free replays and heatmaps with no traffic limit.
- Smart events without setup (Outbound click, Purchase).
- Gaps:
- Inflated sessions and France.
- No page-view total.
- Dead-click detection misses the real dead button and flags text instead.
- A tight MCP window (last 1-3 days, 10 calls a day).
- By design: a replay and heatmap tool: time only per session; its cookie waits for consent.
13.12 Mouseflow
- Type: session replay and heatmaps.
- Plan: free, 500 sessions. Setup took 2 steps, but it records nothing until "Activate Tracking", and it started a Premium trial unasked.
- Delivered: 82 visits; it records 55 sessions, and nothing from headless Chromium.
- Dashboard: findability 3.9.
- Counts only recorded sessions.
- No source report found.
- France read off a bar chart with no numbers.
- Contact funnel 0.
- Purchases only as tags on 2 sessions, no amount.
- Times are in UTC.
- MCP: Premium only; not tested.
- All days, AI and apps: recognises visitors across days; records nothing for webdriver browsers; sessions sat under Live Sessions for 40+ minutes before moving to Recorded; tagged the ChatGPT app visit
utm_source=chatgpt.com. - Strengths:
- Recognised visitors across days.
- Live sessions, and UTM values as tags.
- Gaps:
- No downloads or outbound clicks outside the heatmap viewer, and no purchase amounts.
- France only as a bar chart without numbers; no source report found.
- Sessions waited 40+ minutes under Live Sessions before reaching Recorded.
- By design: it records a sample (500 sessions a month on the free plan) and nothing from
navigator.webdriverbrowsers.
13.13 Sentry
- Type: error monitoring with session replay.
- Plan: Developer, 50 replays a month. Setup took 5 steps.
- Dashboard: only Q8. "Most Dead Clicks: button#b 3" is a ready widget; no rage clicks.
- MCP: official, hosted, OAuth.
- It failed to connect in the parallel round 1, then worked alone.
- Relative periods only.
- Opus counted replays by hand (France 13,
/templates3). - Its report used the
#r=run labels to spot test traffic.
- All days, AI and apps: replays only; stopped on the stored consent decline; places NordVPN's PacketHub exits in Brazil.
- Strengths:
- Found the "Save draft" error and the failing Mouseflow script.
- A ready dead-click widget (
button#b). - Its MCP report found all three site defects.
- Gaps:
- Labels replays by full IP address.
- Relative periods only through MCP.
- By design: an error tracker with replays, no analytics.
13.14 LogRocket
- Type: session replay.
- Plan: free, 1,000 sessions. Setup took 1 step.
- Delivered: 97 visits.
- Dashboard: 5 ✓, findability 2.9.
- The session list with filters is the analytics tool. It was exact: 97 sessions, France 18, LinkedIn 11, purchases 7.
- Dashboards show only the last day of a range, with no totals.
- Rage clicks: "No sessions found".
- MCP: official, hosted.
- Natural-language
build_metricmoved the period into 19 Nov in five of ten answers (Sonnet), and answered two questions with a question back. - Opus kept the period.
- Very large answers: 15,000-26,000 characters on average.
- Natural-language
- All days, AI and apps: recorded every JavaScript visit, consent declines included (it has no consent call), and labels sessions with the full IP address; no bot or source fields.
- Strengths:
- Session count exact (97 for 97), with France and purchases exact.
- Dead clicks on "Duplicate form" exact (7 sessions).
- Its MCP report found all three site defects, with every number found in its tool results.
- Gaps:
- Dashboards show only the last day of a range, with no totals.
- The Sonnet MCP run moved the period in five of ten answers.
- Labels one session by full IP address.
- Its report called the PDF link broken.
- By design: session replay; no consent call, so it records consent declines too.
13.15 Cloudflare Web Analytics
- Type: cookieless page-load analytics; visits only.
- Plan: free. Setup took 4 steps.
- Delivered: 95 visits.
- Dashboard: 4 ✓.
- Visits (95, exact), page views, referrers, countries and paths.
- No events, time on page or funnels.
- The site's name in the site list links to the site itself; that is how the stray visit happened.
- MCP: the generic Cloudflare API server.
- The assistant writes JavaScript and GraphQL; introspection failed and field names were guessed.
- It could change any resource the token allows, with no read-only mode.
- All days, AI and apps: with the site behind Cloudflare, the edge labelled ChatGPT-User "AI Assistant" and OAI-SearchBot "Search Engine Crawler", nothing else; AI Crawl Control's chart showed ChatGPT-User 2 and Claude-User 1 while its totals said 0. Web Analytics counted the webdriver page-weight runs as 6 visits for 6 page loads.
- Strengths:
- Visits exact (95 for 95), free and with no setup.
- At the edge, it labelled ChatGPT-User as an AI assistant.
- Gaps:
- Its MCP report recommended speeding up pages measured at 12-14 s through residential proxies.
- AI Crawl Control's totals said 0 while its chart showed the AI fetches.
- By design: page loads and visits only: no events, time on page or funnels.
14. Limits and open questions
14.1 Limitations
- Scripted visitors, not real ones. Every r4 visit was driven by Playwright with person-like input. The four manual visits are the only real browsers. Plausible's handling shows that a tool can treat an automation build differently from the real browser, so absolute counts for Plausible say more about Playwright's Chromium than about Chrome users.
- Small numbers. 104 visits over two days is enough to see systematic differences: missing reports, wrong units, inflated times, timezone shifts. It is too few to estimate a tool's error rate.
- Residential IPs did not stick across days. Next-day returns therefore test only browser-held identity (cookies, storage), never IP+UA hashing. The daily-salt test rests on three personas of the midnight pair.
- Proxy artefacts. Exits failed to reach single tool hosts (GA4 twice), changed mid-visit (two visits), or cut WebKit's leave-time sends. All are recorded in chapter 4 and excluded from expected numbers where they prevented delivery. None were re-run, because a re-run would double-count in every other tool.
- Upper bounds for consent-gated tools. A 2xx from a tool after an opt-out can be a configuration request, so their expected numbers are upper bounds.
- Two tools off UTC. GA4 and Pirsch could not be read in UTC days in their dashboards. GA4 is compared on its own window.
- Findability is one assessor's judgement, applied the same way to every tool; the answers are quoted so readers can judge for themselves.
- MCP:
- One run per model and task.
- One client only (Claude Code). claude.ai, the desktop app, Cursor and Codex sign in differently.
- Report quality was judged by us only.
- Three tools (Umami, Amplitude, Mouseflow) were not testable on our plans, and Fathom has no usable server.
- AI and app rounds: one of each. One ChatGPT, one Claude, one Gemini fetch, one agent visit, three app links from one phone on Wi-Fi. They show what each tool does with such a request, not how often assistants fetch.
- The agent and page-weight visits on 20 Nov came through a VPN (German exit). That exposed Matomo's VPN drops and Fathom's and Sentry's Brazil placement, and it means the agent visit is also a VPN visit.
- Privatrak is ours. Section 3.12 lists the safeguards and their limits.
14.2 Questions answered along the way
The two-day tests left eleven questions open. Reading every day and running the later rounds answered most of them.
- Matomo's 49 of 78: the 30-minute visit merge (78 → 59) and NordVPN visits Matomo drops (11 of 13), above. One residential visit is left.
- No
/contact→/thanksin PostHog, Clarity, Mouseflow, Amplitude: of the four 17-18 Nov visits that reached/thanks, three declined the consent banner and the fourth was a marked (webdriver) WebKit visit, so the consent-gated tools rightly hold almost nothing of the step. Clarity keeps declined visits but, without its cookie, cuts every page into its own session (seen live on 20 Nov), so a funnel inside a session cannot form. - Inflated time on page (Pirsch 18 min 16 s, Amplitude 18 min 45 s):
consistent with "time to the same visitor's next page view, across
visits". Over the
/articleviews of 17-18 Nov that each tool received and that had a later page view by the same persona on the same day, the mean gap is 15.2 min (Pirsch's visits) and 18.1 min (Amplitude's); within a visit no/articleview was followed by another page. Not proven per view, since neither tool exports per-view times on our plans. - Fathom's Brazil: Fathom (and Sentry) place NordVPN's PacketHub addresses in Brazil: on 20 Nov exactly the visits through that VPN's German exit (Cloudflare: DE) are Fathom's Brazil, and residential exits add more on other days.
- Fathom's 174 page views for 194 delivered: still open (the shortfall is on the burst days; 20 Nov is exact).
- Plausible's 31 visitors for 26 person-days: visitors split by IP changes (the phone, p19); page views are exact.
- Firefox cross-site leave: tested locally
(a throwaway server on
localhost→127.0.0.1, no visit to the site): Firefox, also with strict tracking protection, deliverssendBeacon,fetch(keepalive)and an image request frompagehideon a cross-site same-tab navigation; WebKit delivers none of the three (and all three on a same-site navigation); Chromium all. So p13's lost leave is not Firefox's navigation behaviour; the proxied, strict context (NS_BINDING_ABORTED) remains the likely cause. - Marked and agent-like visits: answered per tool (section 10.11).
- DNT and GPC: in the series Mixpanel and Clarity sent nothing for the three personas that send both. On 20 Nov the agent's Chrome sent DNT alone: Mixpanel dropped it, Clarity recorded it. So Mixpanel honours DNT; Clarity reacts to GPC (or the pair), not to DNT alone.
- The TypeError after "Place order": Privatrak recorded 4 error clicks
on it (15, 16 ×2, 17 Nov), each at the time of a WebKit, Firefox or
marked-Chromium buyer visit. The page's own code throws nothing: the
checkout page served locally with every tool's script loaded and its
data requests blocked raised no error after the click in WebKit, Firefox
or Chromium. Privatrak counts an unhandled promise rejection from any
script after a click, and the click navigates away
after 300 ms, which cancels the tools' in-flight requests (WebKit
rejects those as
TypeError: Load failed); a tool's rejected request is the likely source. Not confirmed; Privatrak stores the error type only. - AI fetchers, agents, apps, heatmaps: run on 20 Nov (chapter 11, and the heatmap viewers in chapter 10).
14.3 Still open
- Fathom's 174 page views for 194 delivered on 17-18 Nov (20 Nov is exact). Fathom's per-page counts for the burst hours against the visit records would show which views it leaves out.
- Matomo's VPN drops: which setting or list makes Matomo Cloud discard these visits, and why one residential visit (
r4-d2-p07-alt-ip) is missing too. The system settings are not readable with our access. - The source of the "Place order" TypeError, by recording one WebKit purchase with the tools' requests live.
14.4 Data and reproducibility
Published with this paper, under CC BY 4.0:
| File | What it holds |
|---|---|
visits.jsonl | every visit of series r2, r3 and r4 and the check visits: persona, day, network kind, engine, mode, consent, source, pages with times, what the visit did, and every tool's request outcomes; IP networks replaced by pseudonyms (network_id) |
expected-all.json, truth-*.json | the expected numbers per tool and window |
server-side-sends.jsonl | every server-side request to a tool on 20 Nov, with the answer and the tool's verdict; no addresses |
page-weight.json | requests, bytes, cookies and storage per tool for the page-weight runs |
persona-country.json | the country of each persona |
matomo-match.txt | the match of Matomo's visitor log against the visits it was sent |
unrecorded.json | page loads on the site that are not in visits.jsonl (a new tab the runner does not record, our own visits, an unknown visitor, the manual, AI and app rounds), with the page views Privatrak stored of each where known |
Not published: the web server's access logs, the manual and phone rounds' raw records (they hold real people's addresses), and the tools' account data. The appendices quote every dashboard and MCP answer verbatim, with IP addresses removed.
The appendices (every visit, the delivery matrix, the personas, the ground truth and every AI server answer verbatim) are in the PDF; the raw records are in the data download.