Documentation
Set up Privatrak, name what matters to you and read every report.
Dashboards
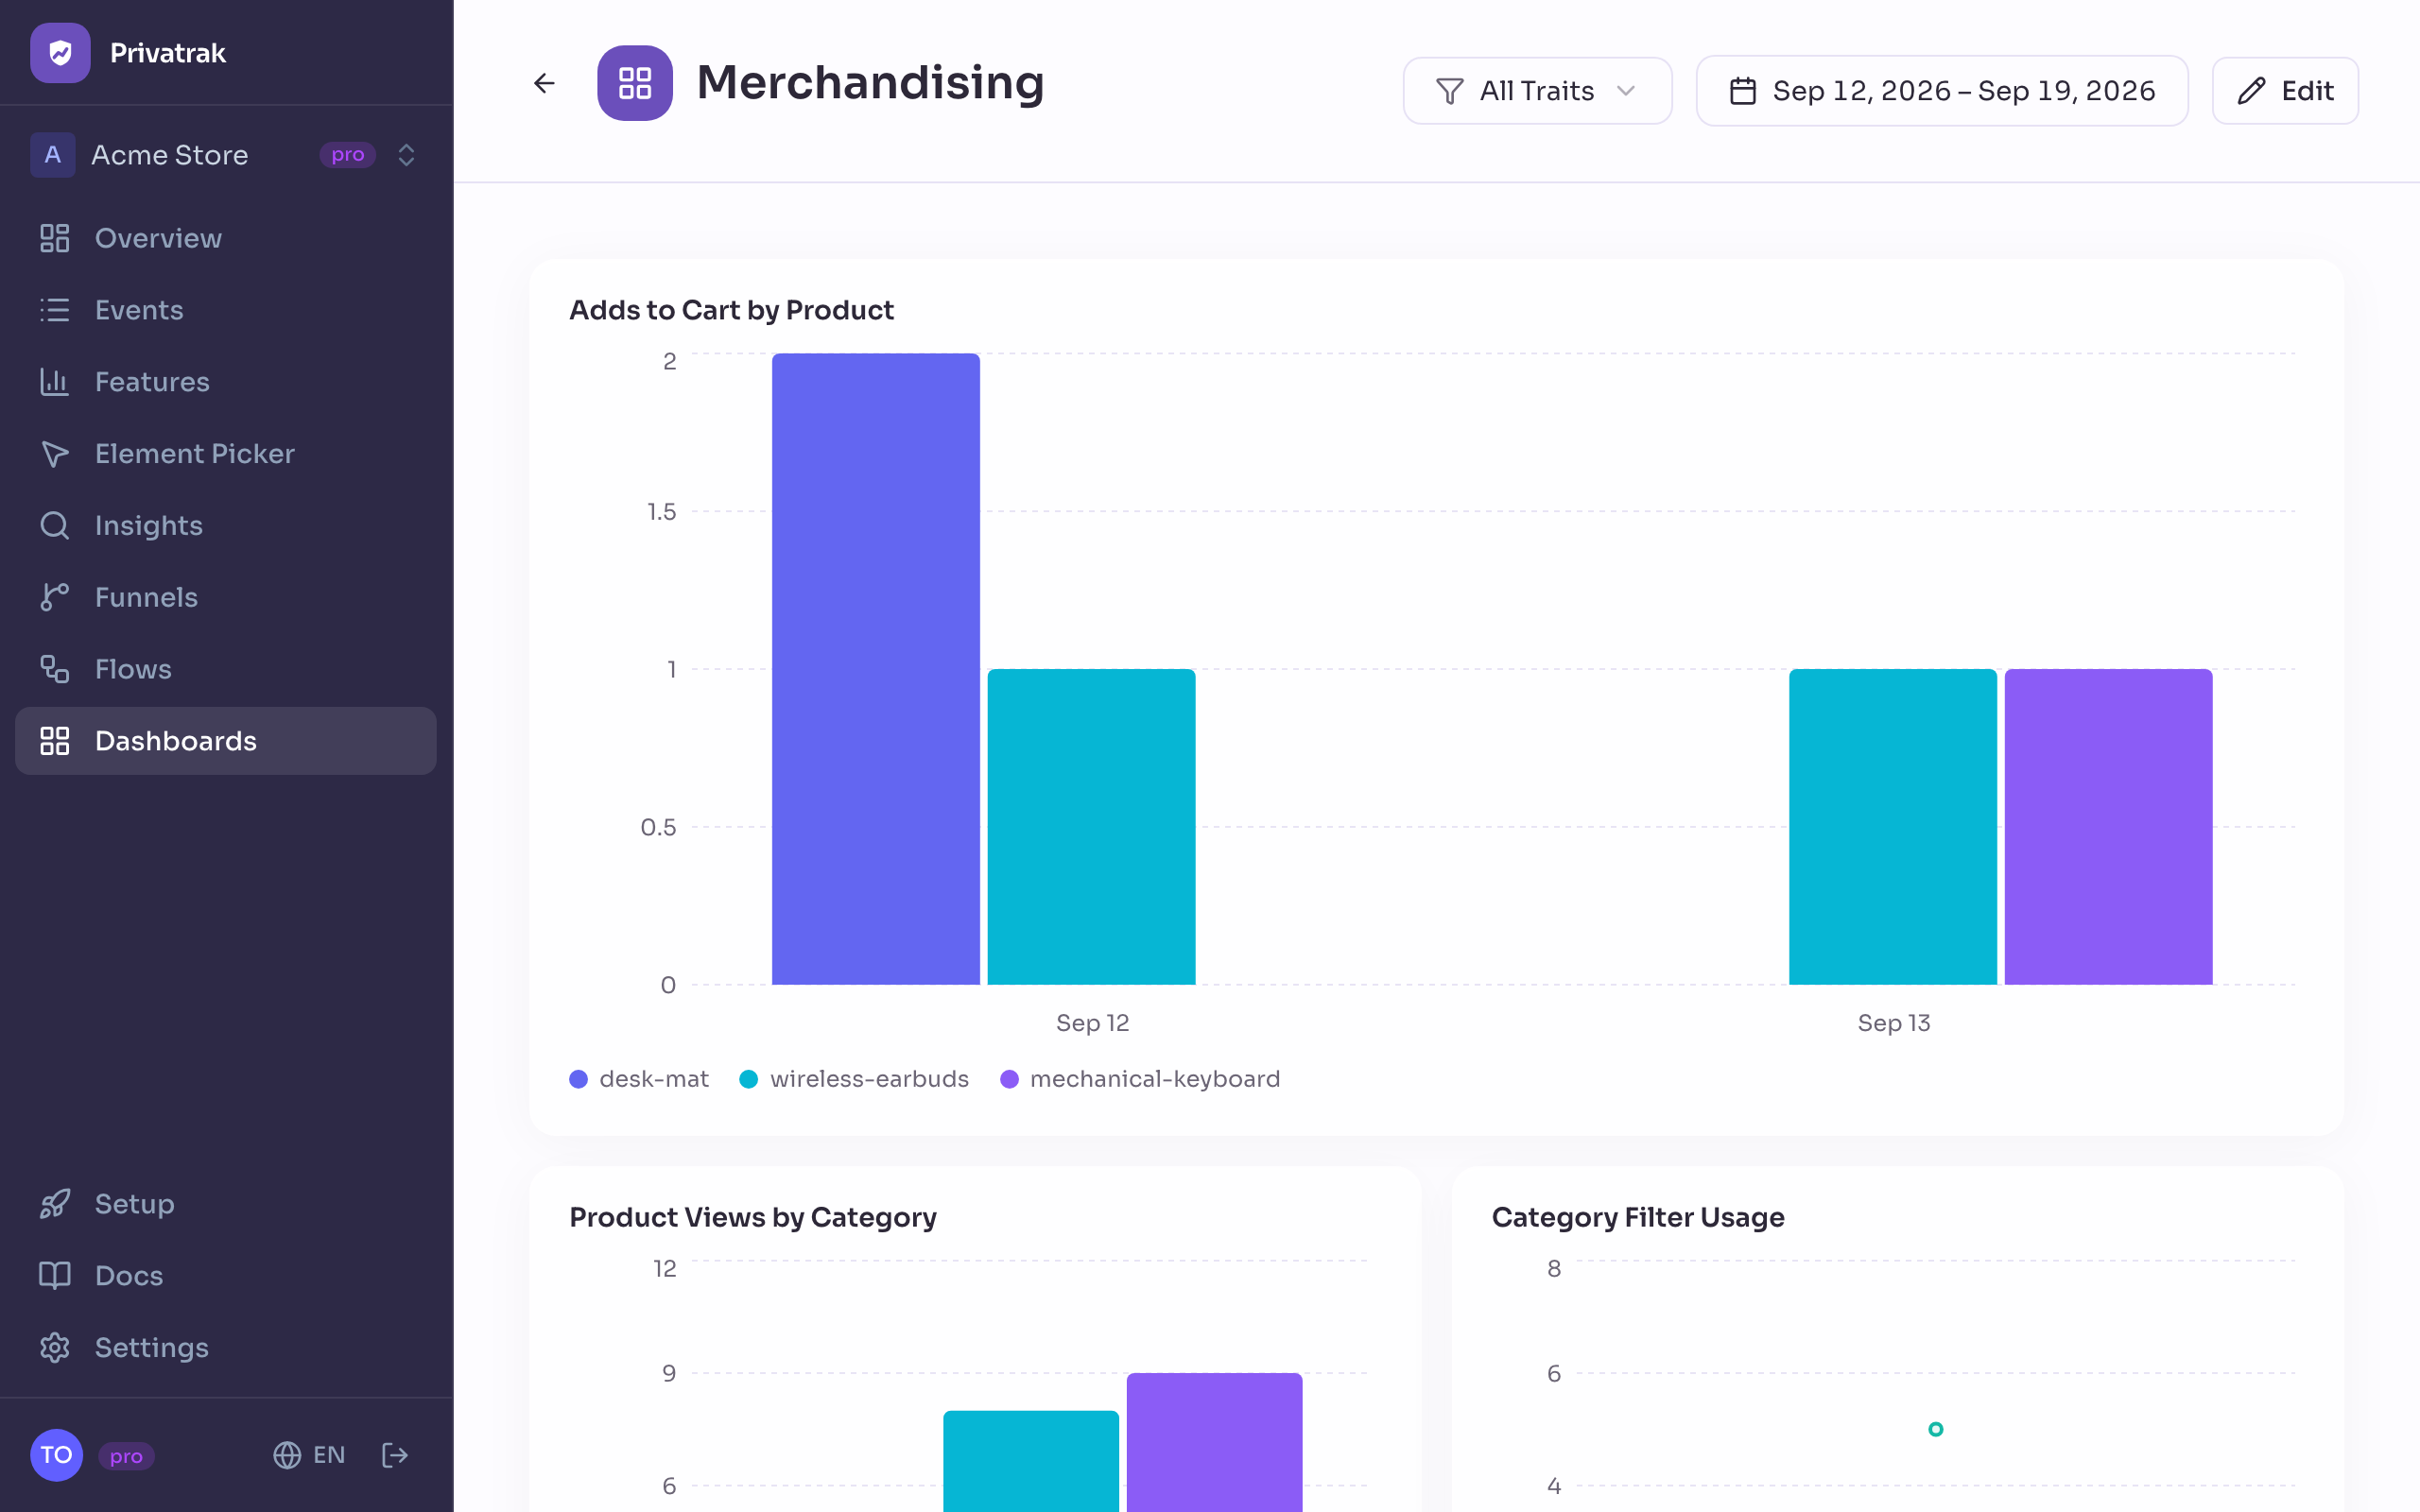
A dashboard puts the Insights queries you check often on one page. That way you build a custom analytics dashboard with exactly the numbers you need. Each widget runs its query again every time you open the dashboard, so you always see current numbers. Open Dashboards to create one.
Create a dashboard
- Open Dashboards and click New Dashboard.
- Enter a name and click Create.
To rename or delete a dashboard, use its menu in the list, or click Edit inside the dashboard.
A project can have up to 1 dashboard on Free, 5 on Starter and 100 on Pro. Enterprise has no limit. When you reach yours, New Dashboard is greyed out. Plans and limits compares the plans.
Add a widget
There are two ways to add a widget:
- From Insights: build and run a query on Insights and click Save to Dashboard. Enter a Title, choose the Dashboard or Create new..., choose Full width or Half width, and click Save. A query with several series becomes one widget with all of them.
- On the dashboard: click Edit, then Add Widget. A New Widget that counts all events per day appears, with its query open so you can change it.
A dashboard holds up to 6 widgets on Free, 15 on Starter and 100 on Pro. Enterprise has no limit.
Arrange and edit widgets
Click Edit at the top of the dashboard. Then you can:
- Drag a widget to another place.
- Drag its bottom right corner to make it wider or taller.
- Click its title and type a new one.
- Change its query with Edit widget query. You get the same controls as in Insights, series included, plus the chart types Line, Area, Bar, Single value and Table. Click Run Query to preview the result, then Apply.
- Take it off the dashboard with Remove widget.
Click Save to keep your changes, or Discard to undo all of them.
Show headline numbers with Single value
A widget shown as a Single value puts your headline numbers at the top of a dashboard, each with its change against the previous period. It reads well down to the smallest size, a quarter of the width. When it is narrow, several series show as one line each, with their value and change. Make the widget taller to add each series’ trend line.
Show a table on a dashboard
A Table widget fills its box, and its rows scroll inside it. Click a heading to sort by another column. While you edit the dashboard, the order you choose is saved with the widget.
Change the dates and compare groups
The date range and All Traits at the top apply to every widget at once. Pick last month, or one group of visitors, and the whole dashboard shows it.
A widget grouped by Hour needs a date range of up to 31 days. On a longer one it shows days and says so under its title. Its query stays as you saved it.
Everyone in the project sees the same dashboards. Insights explains what a query counts and how to read its chart.