Documentation
Set up Privatrak, name what matters to you and read every report.
Track revenue in WooCommerce
Google Analytics and similar tools only count shoppers who accept a cookie banner, and in Europe that can leave out a large share of visitors. Privatrak needs no consent banner, so your revenue, orders and average order value cover every shopper who visits your store. The plugin already records every completed order as the custom event Purchase, with its total, currency and number of items. This guide builds your revenue, your orders, your average order value and your revenue per day in Insights, and saves each one to a dashboard.
The example in this guide
Kitchen & Desk, a WooCommerce store for kitchen and desk accessories, uses Privatrak to see its revenue, its orders and the products people add to their cart. Its dashboard is called Shop overview.
Before you start
The plugin is installed and connected, as Install on WordPress shows. Privatrak then records every completed order as Purchase, without anything else to set up.
1. Add your revenue
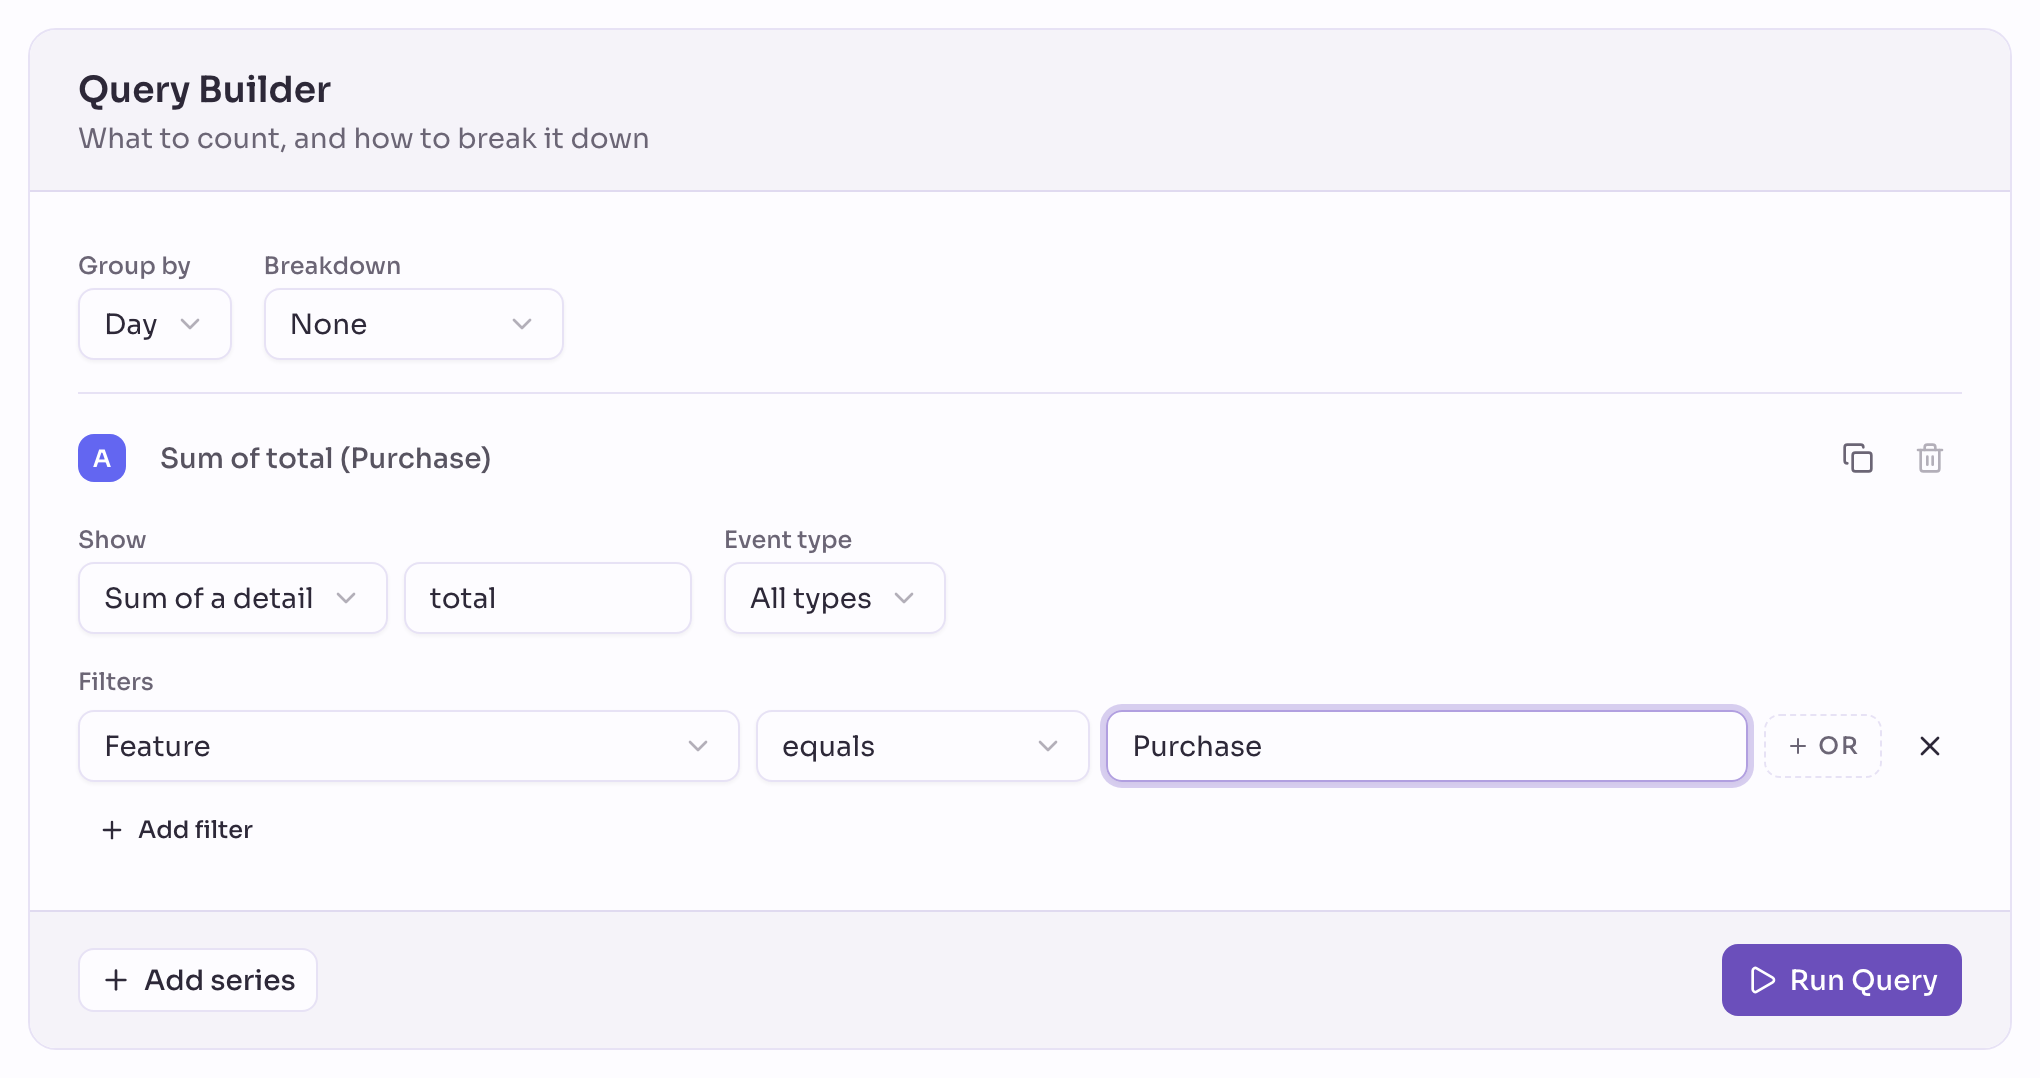
Open Insights and pick the date range at the top. Under series A, choose Sum of a detail under Show and enter total in Detail name.
Under Filters, click Add filter and choose Feature equals Purchase, so only completed orders count. Name the series Revenue.
2. Add your orders
Click the copy button to the right of the name to duplicate Revenue into series B. Choose Number of events under Show and name it Orders.
3. Add your average order value, then save
Click the copy button to the right of the name again to duplicate Orders into series C. Choose Average of a detail under Show and enter total. Name it Average order.
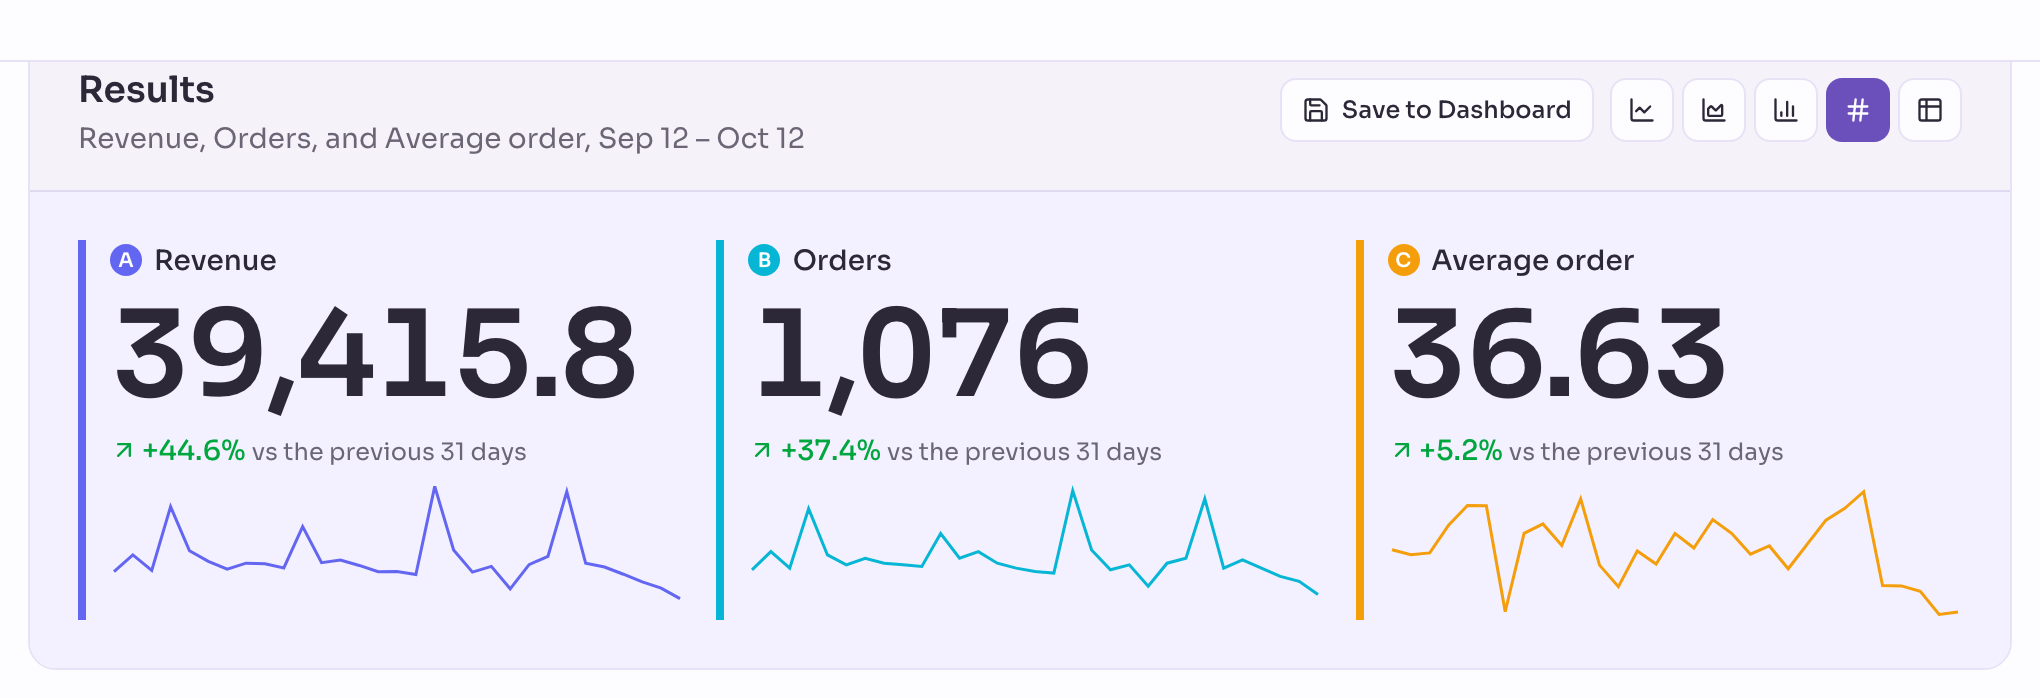
Click Run Query, then Single value. Click Save to Dashboard, name the widget Shop totals, choose a dashboard and a width, and click Save. All three series are saved together, in one widget.
Compare with the previous period
Under each number, Privatrak shows how much it changed against the previous period of the same length, with a small trend line. New means there was nothing to compare with yet.
4. Chart your revenue per day
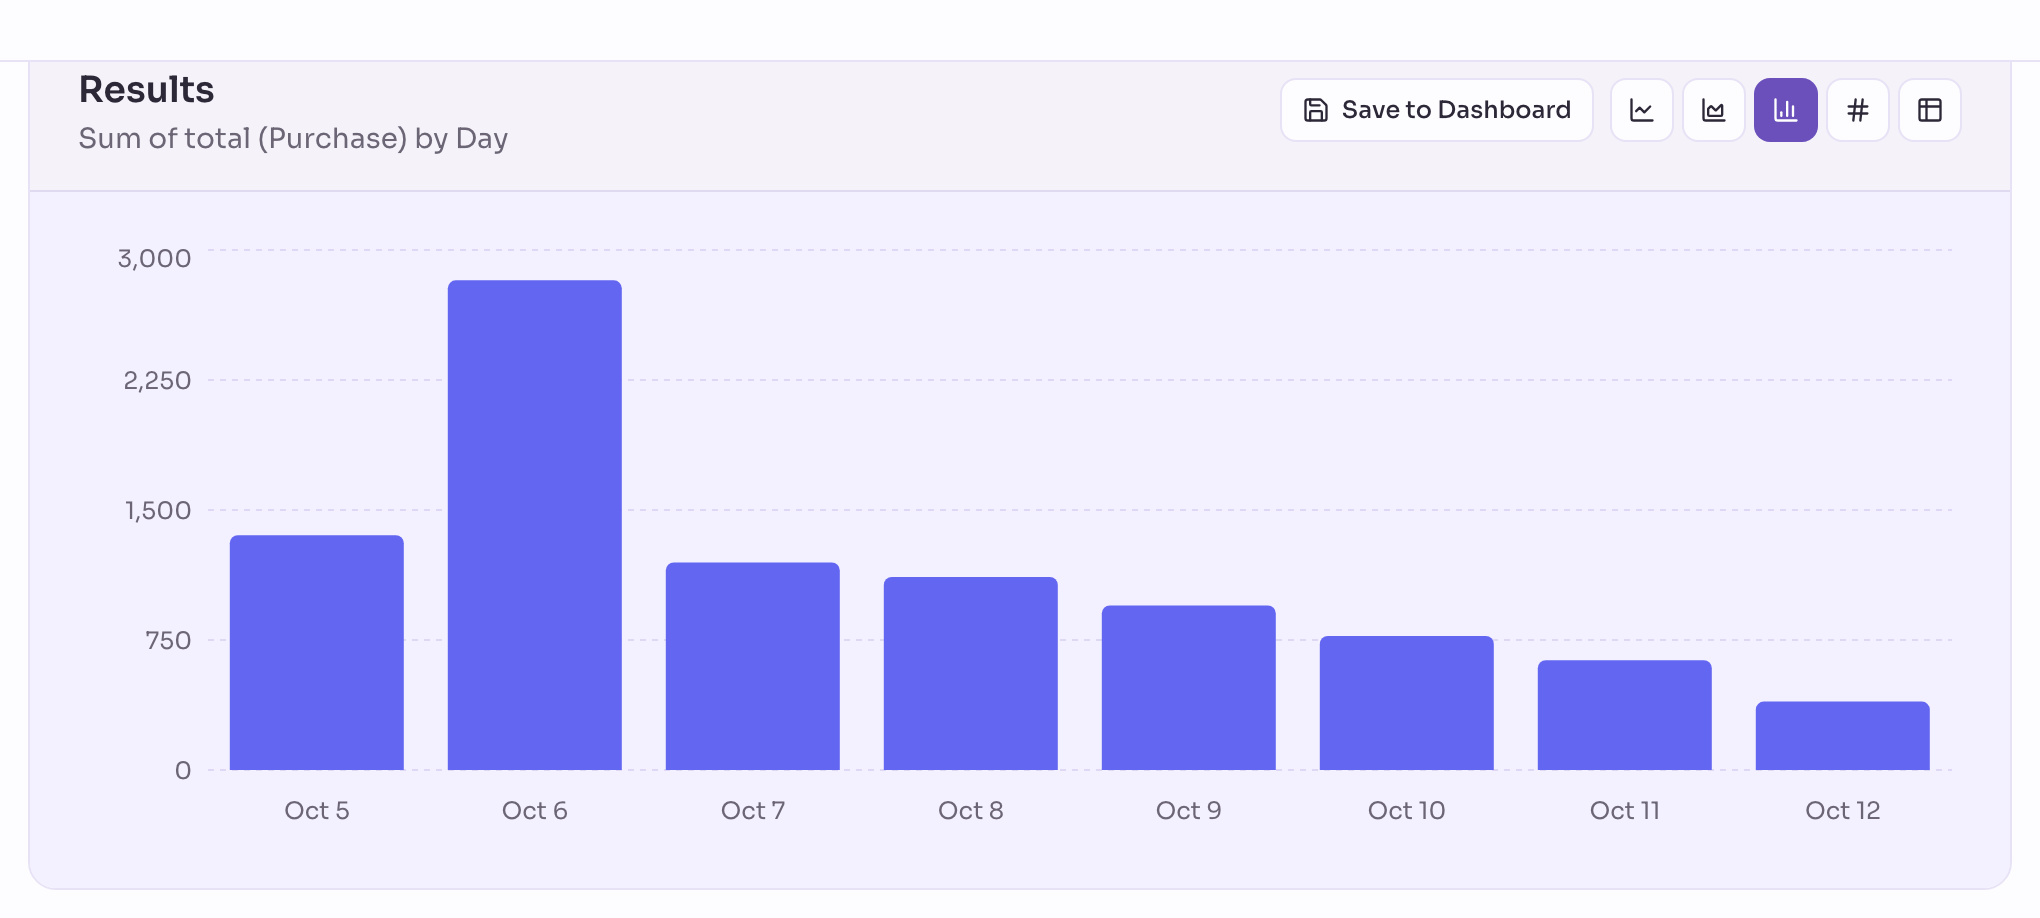
Build the revenue query again: Sum of a detail of total, filtered to Feature equals Purchase. Under Group by, choose Day. Click Run Query, then Bar, and Save to Dashboard at Full width.
5. List what goes into the cart
Open Insights again. Under series A, add the filter Feature equals Add to cart and name the series Added. Under Breakdown, choose Detail and enter product in Detail name.
Click the copy button to the right of the name. Under series B, choose Sum of a detail under Show, enter price, and name it Value.
Click Run Query, then Table. Click Save to Dashboard to keep it as a widget.
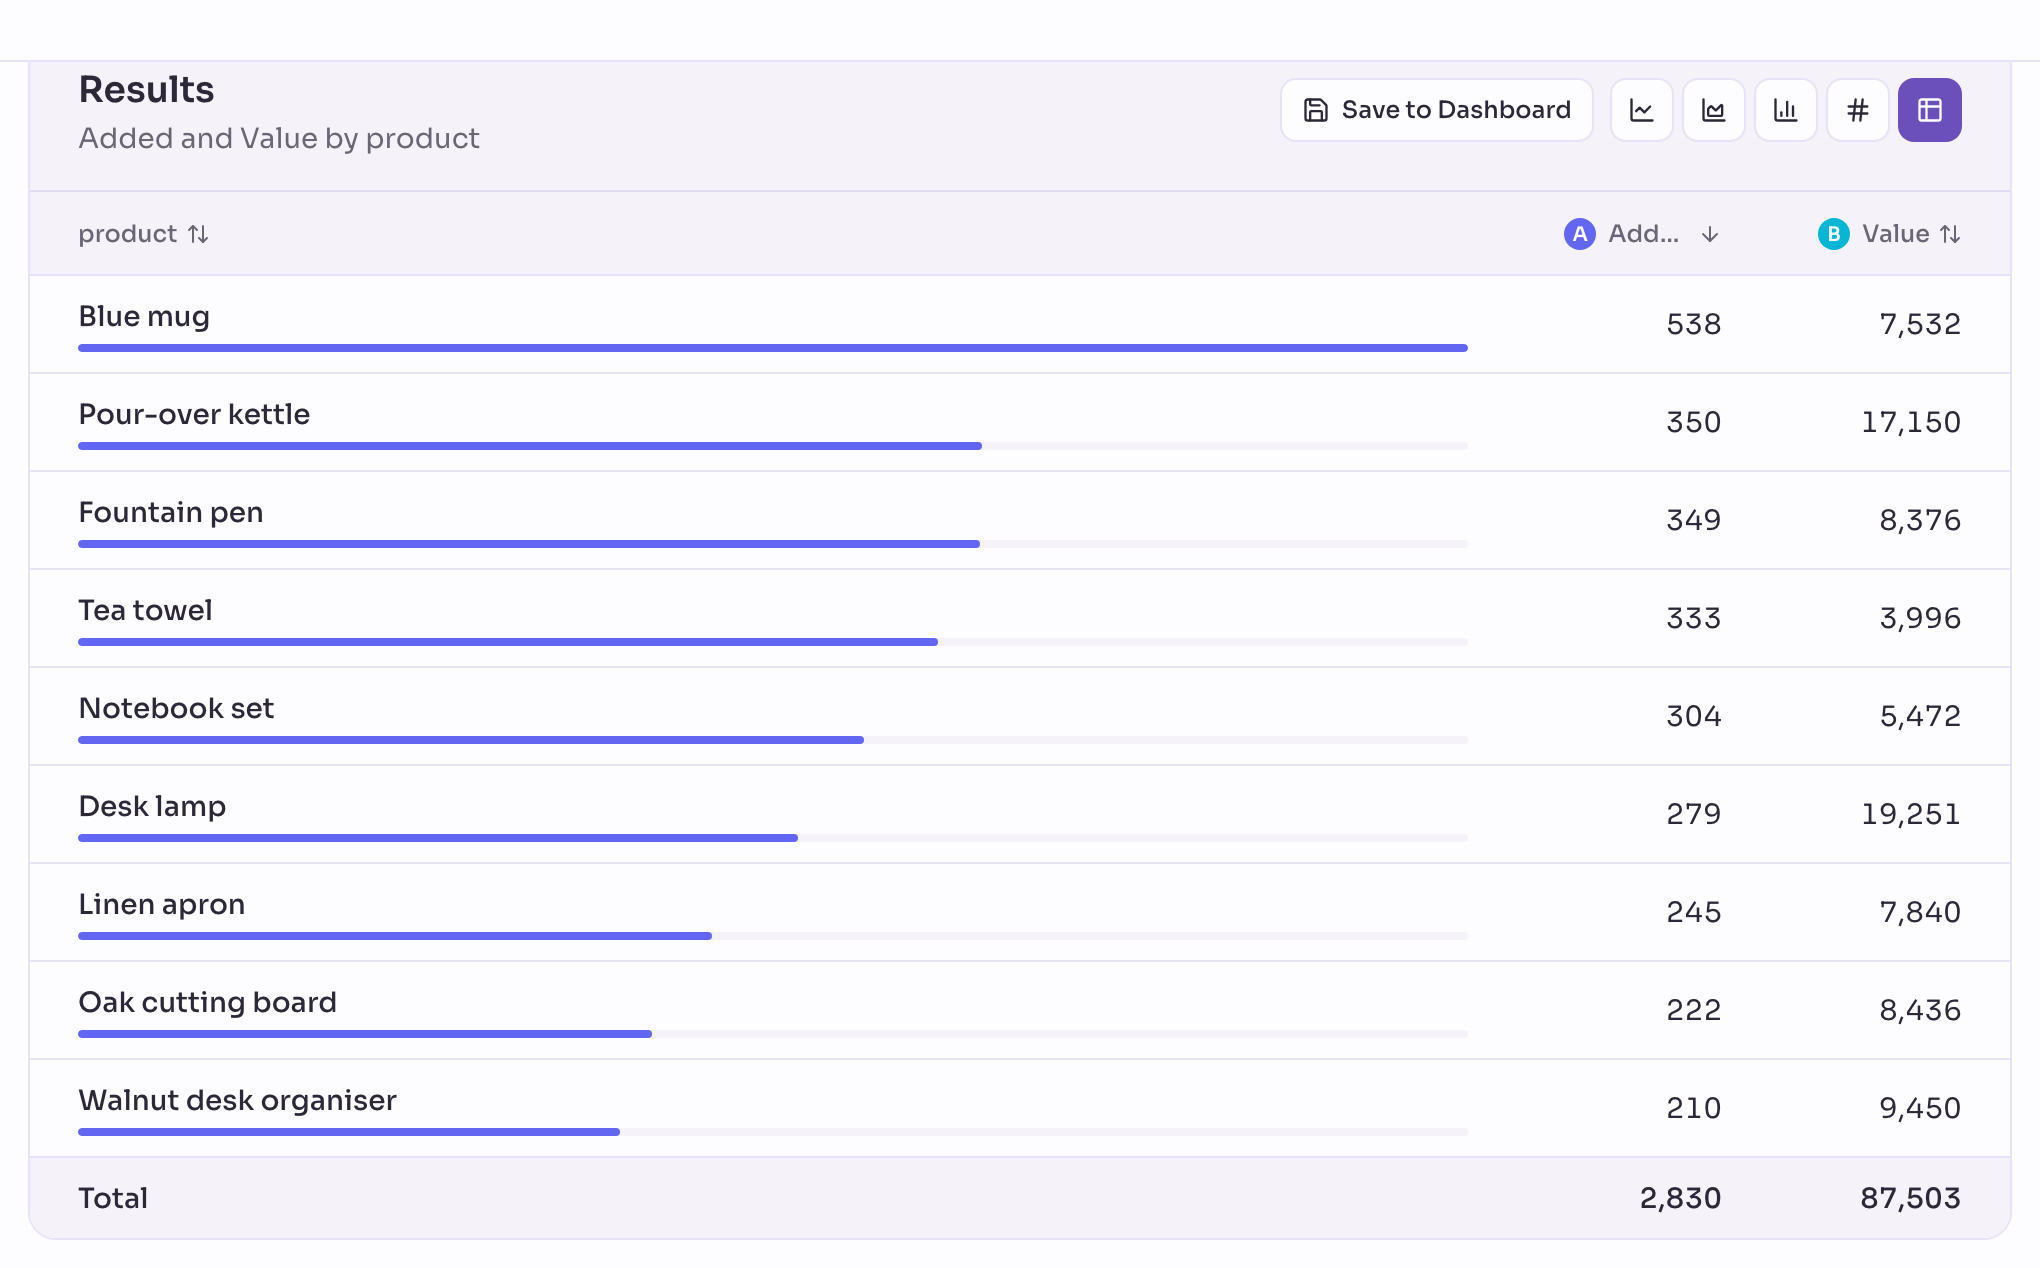
This counts what shoppers add to the cart, not what they buy, so it isn't the same as revenue by product. Products with several options, such as size or colour, add to Added but not to Value, because they have no price until the shopper picks one.
What the numbers mean
A sum adds up numbers whatever currency they're in. A store that sells in several currencies should filter on the Detail currency and build one chart per currency.
The Purchase event carries no products, so revenue by product isn't available. The table above counts what's added to the cart, not what's sold.
Next steps
- Measure your WooCommerce cart abandonment rate: build a conversion funnel from the cart to the purchase.
- WooCommerce analytics: everything Privatrak records in your store without any setup.
- Dashboards: arrange your widgets and add more.